Confirmed: Fraser Valley Reverts to “Normal” Market
Back in February, we had started to see many of the key market stats, as reported by the Fraser Valley Real Estate Board, begin to undergo what appeared to be a reversion to historically average levels. It’s been a number of months since our last investigation, so I thought it was time to check back in.
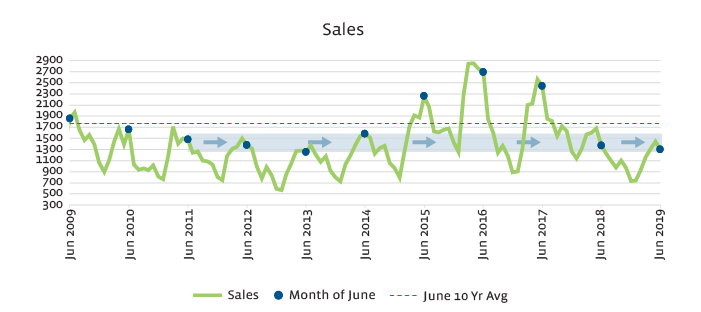
The following charts represent total cumulative values across all residential home types for the entire Fraser Valley, over the last 10 years. The blue dots mark June in each year and the red line represents the 10 year average for the month of June.
Sales, active listings, new listings and sale price as a percent of list price have all returned to levels experienced in 2011 to 2015 – a period that most would consider to be a healthy, active, predictable market. Furthermore, average days on market is outperforming that same period.
Sales Return to June 2011-2014 Levels
If you carry a line from the June sales quantities (the blue dots below) in 2011-2014 through the mayhem of 2015-2017, you land right on top of the sales figures of 2018 and 2019 on the right margin of the graph. Compared to the last few years, sales are certainly down, but not relative to past “normal” and healthy market periods.
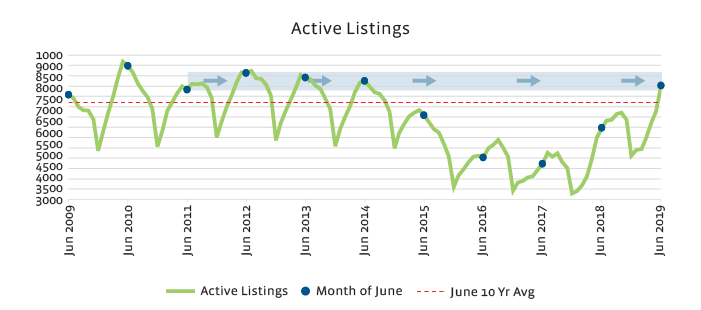
Active Listings Return to Healthier Historical Levels
Active listings are the same story as sales, if you draw the same trend line from June 2011 to 2014 across the below graph to the right side of the graph you land on June 2019. Furthermore, you’ll notice that this June is a similar magnitude above the 10 year average as 2011 to 2014.
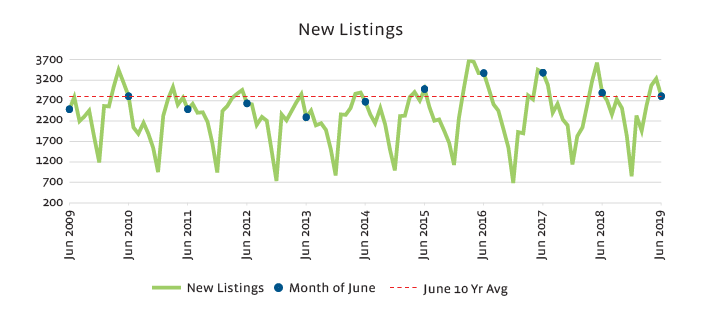
New Listings Return to Expected Quantities
As you can see below, new listings spiked in June 2016 and 2017 but even by June of 2018, the market had already begun to return to the 10 year average (red dashed line) for June, where it sits today.
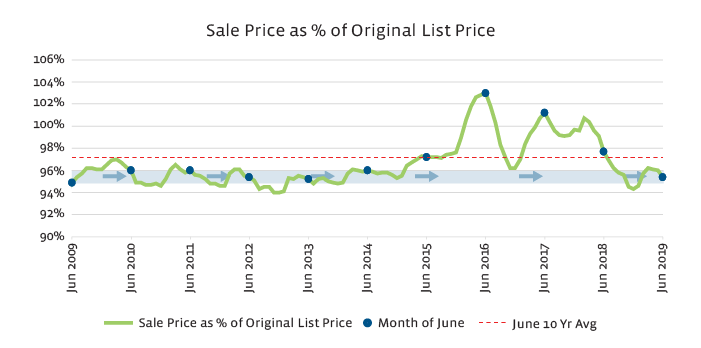
Sale Price as a Percent of List Price Back to Normal
Heightened market activity and extraordinary demand drove sale prices well above list prices from 2016 to 2018 but prior to that the market was consistently reporting sale prices that were 94-97% of the original list price. At 95.4%, June 2019 is squarely in the middle of that historic range.
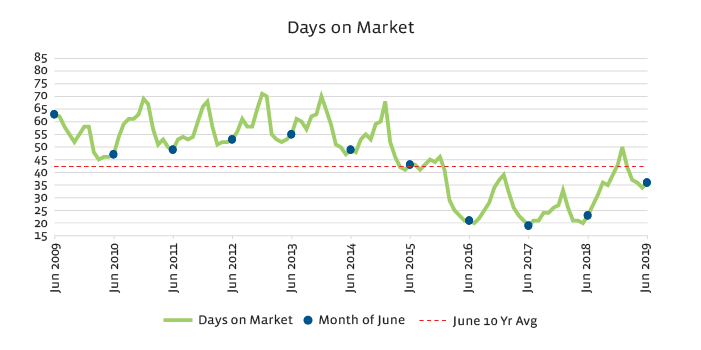
Days on Market Still Outperforming 2011-2015
While many of the key metrics above have returned to levels consistent with 2011 to 2014, average days on market continues to outperform historical levels. The graph below shows that the average days on market for June 2019 is well below June 2011 to 2014 and still hovering below the 10 year average for the month.
The market has certainly softened compared to the sizzling hot market we experienced from 2015 thru 2018 but looking at the bigger picture, history would say the market is reaching a healthy balanced state. The Fraser Valley tends to be a less dramatic market than Vancouver in general, and a lot of the recent headlines could certainly use additional context.
Read the original article The Sky is Not Falling in the Fraser Valley from February 2019 here.
Sources: Fraser Valley Real Estate Board
This representation is based in whole or in part on data generated by the Fraser Valley Real Estate Board which assumes no responsibility for its accuracy.
