Infographic: Fraser Valley Residential Real Estate October 2022
October 2022 housing market statistics are out from the Fraser Valley Real Estate Board and the general market was deemed “balanced” for the fifth consecutive month, a big contrast after a sustained sellers’ market earlier in the year.
KEY TAKEAWAYS FROM OCTOBER 2022 FRASER VALLEY RESIDENTIAL MARKET
- Prices have remained soft, with month-over-month benchmark prices dipping across all property types.
- As prices decreased marginally in all categories, sales for October stayed relatively flat from previous months.
- For detached homes and apartments, the typical number of days on the market was largely unchanged from previous month; however, townhomes moved 15% quicker than the previous month.
- These key metrics indicate that the market is sustaining equilibrium in the wake of the strong sales activity we experienced last year and in the face of ongoing interest rate pressures.
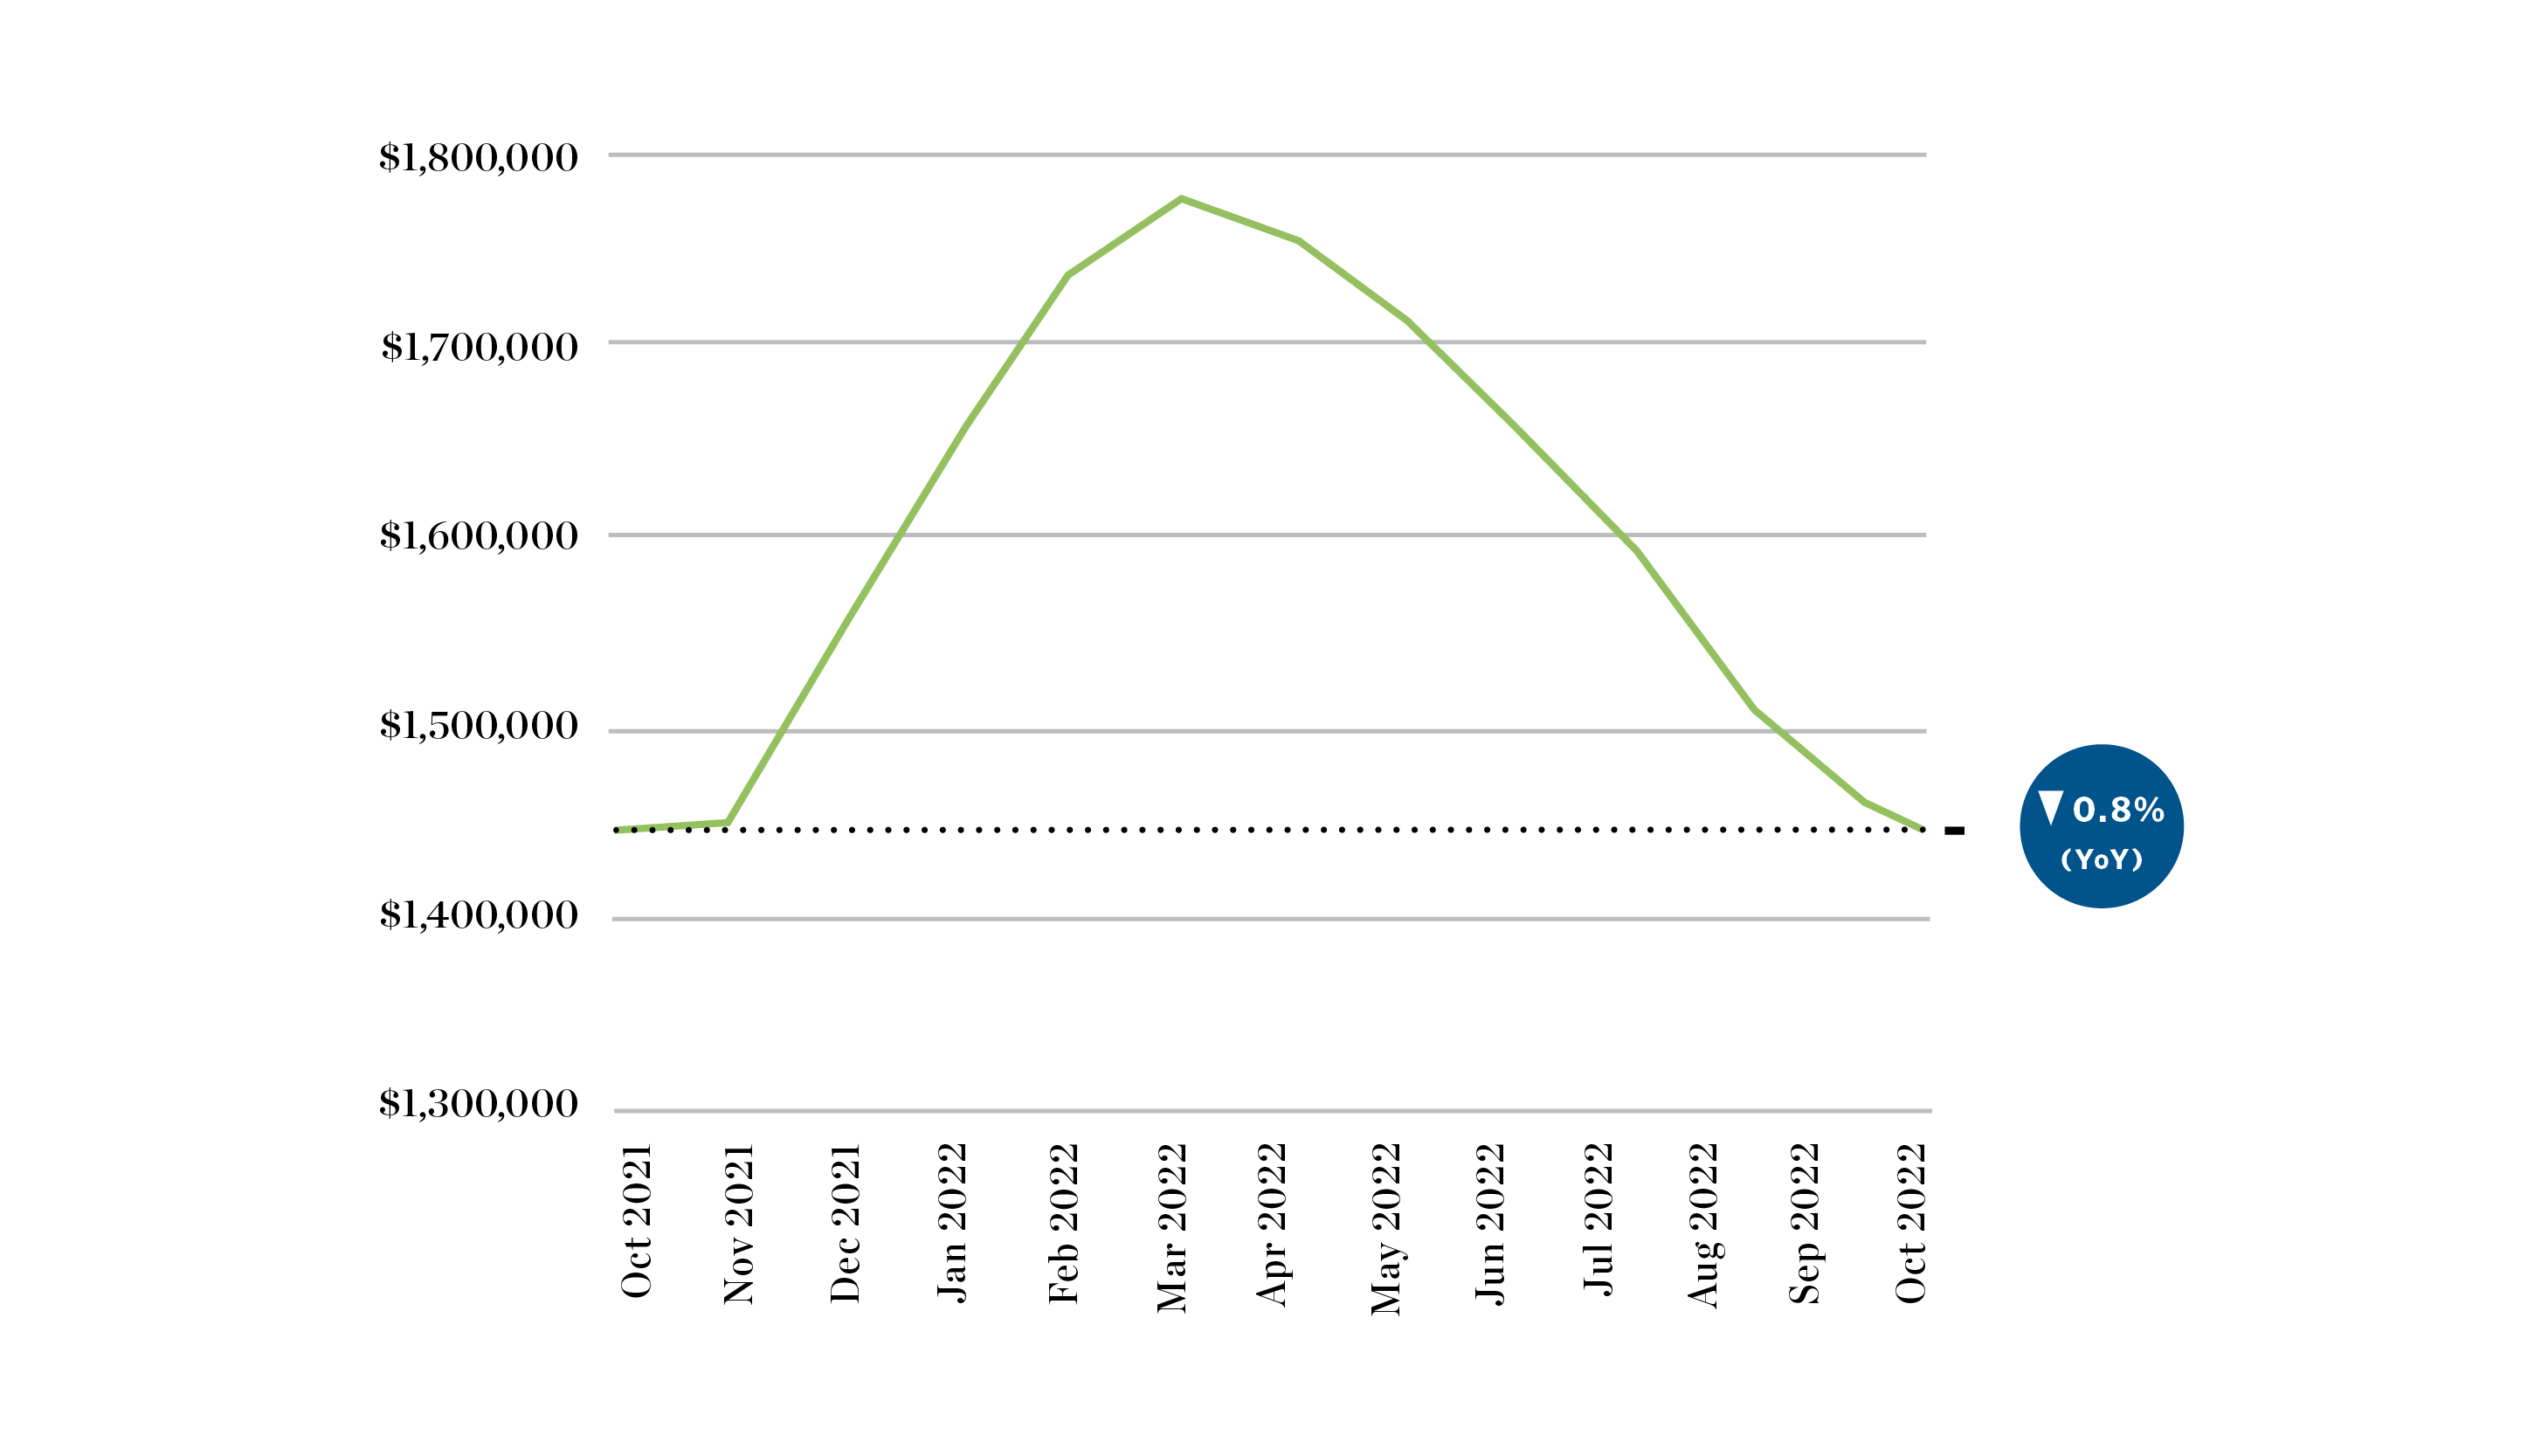
HPI Benchmark Price of Detached Homes
The benchmark price for detached homes continues its downward trend, falling by another 1.8% in comparison to the previous month (from $1,462,000 to $1,436,400).
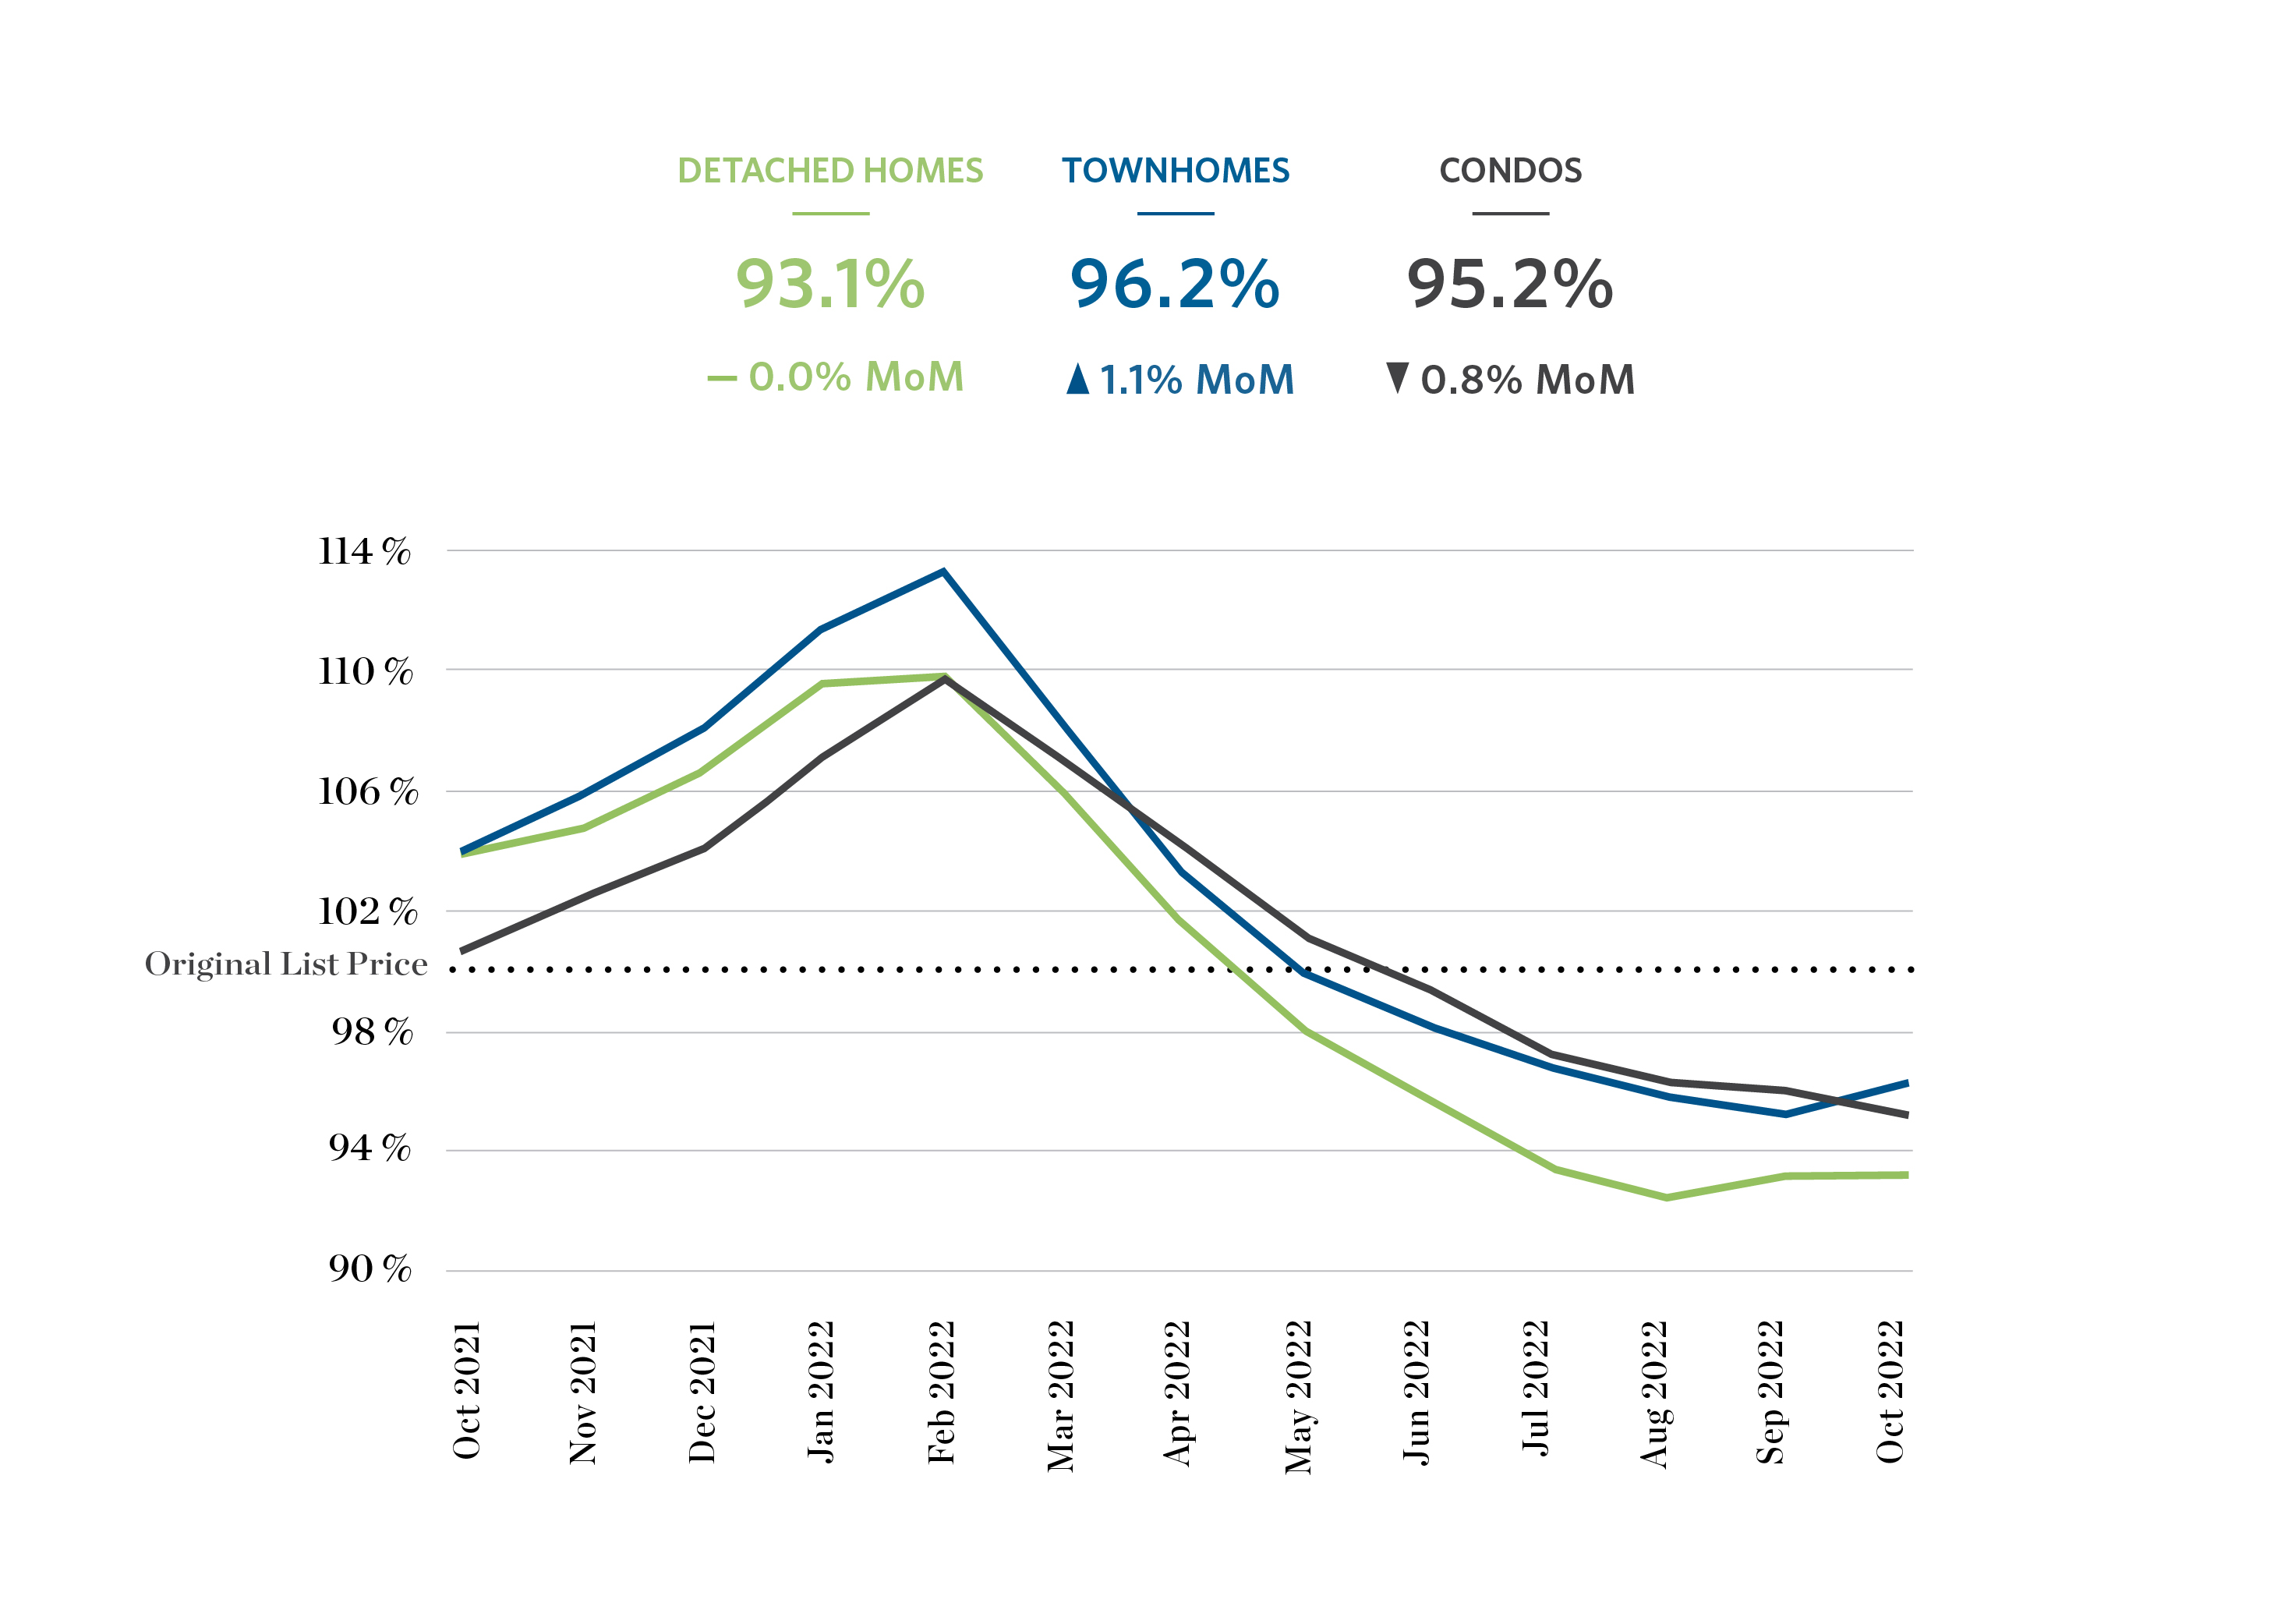
Sale Price As a Percent of Original List Price
Sale price as a percentage of original list price remained similar to September, with townhomes increasing by 1.1%, condos decreasing by 0.8%, and detached homes remaining unchanged.
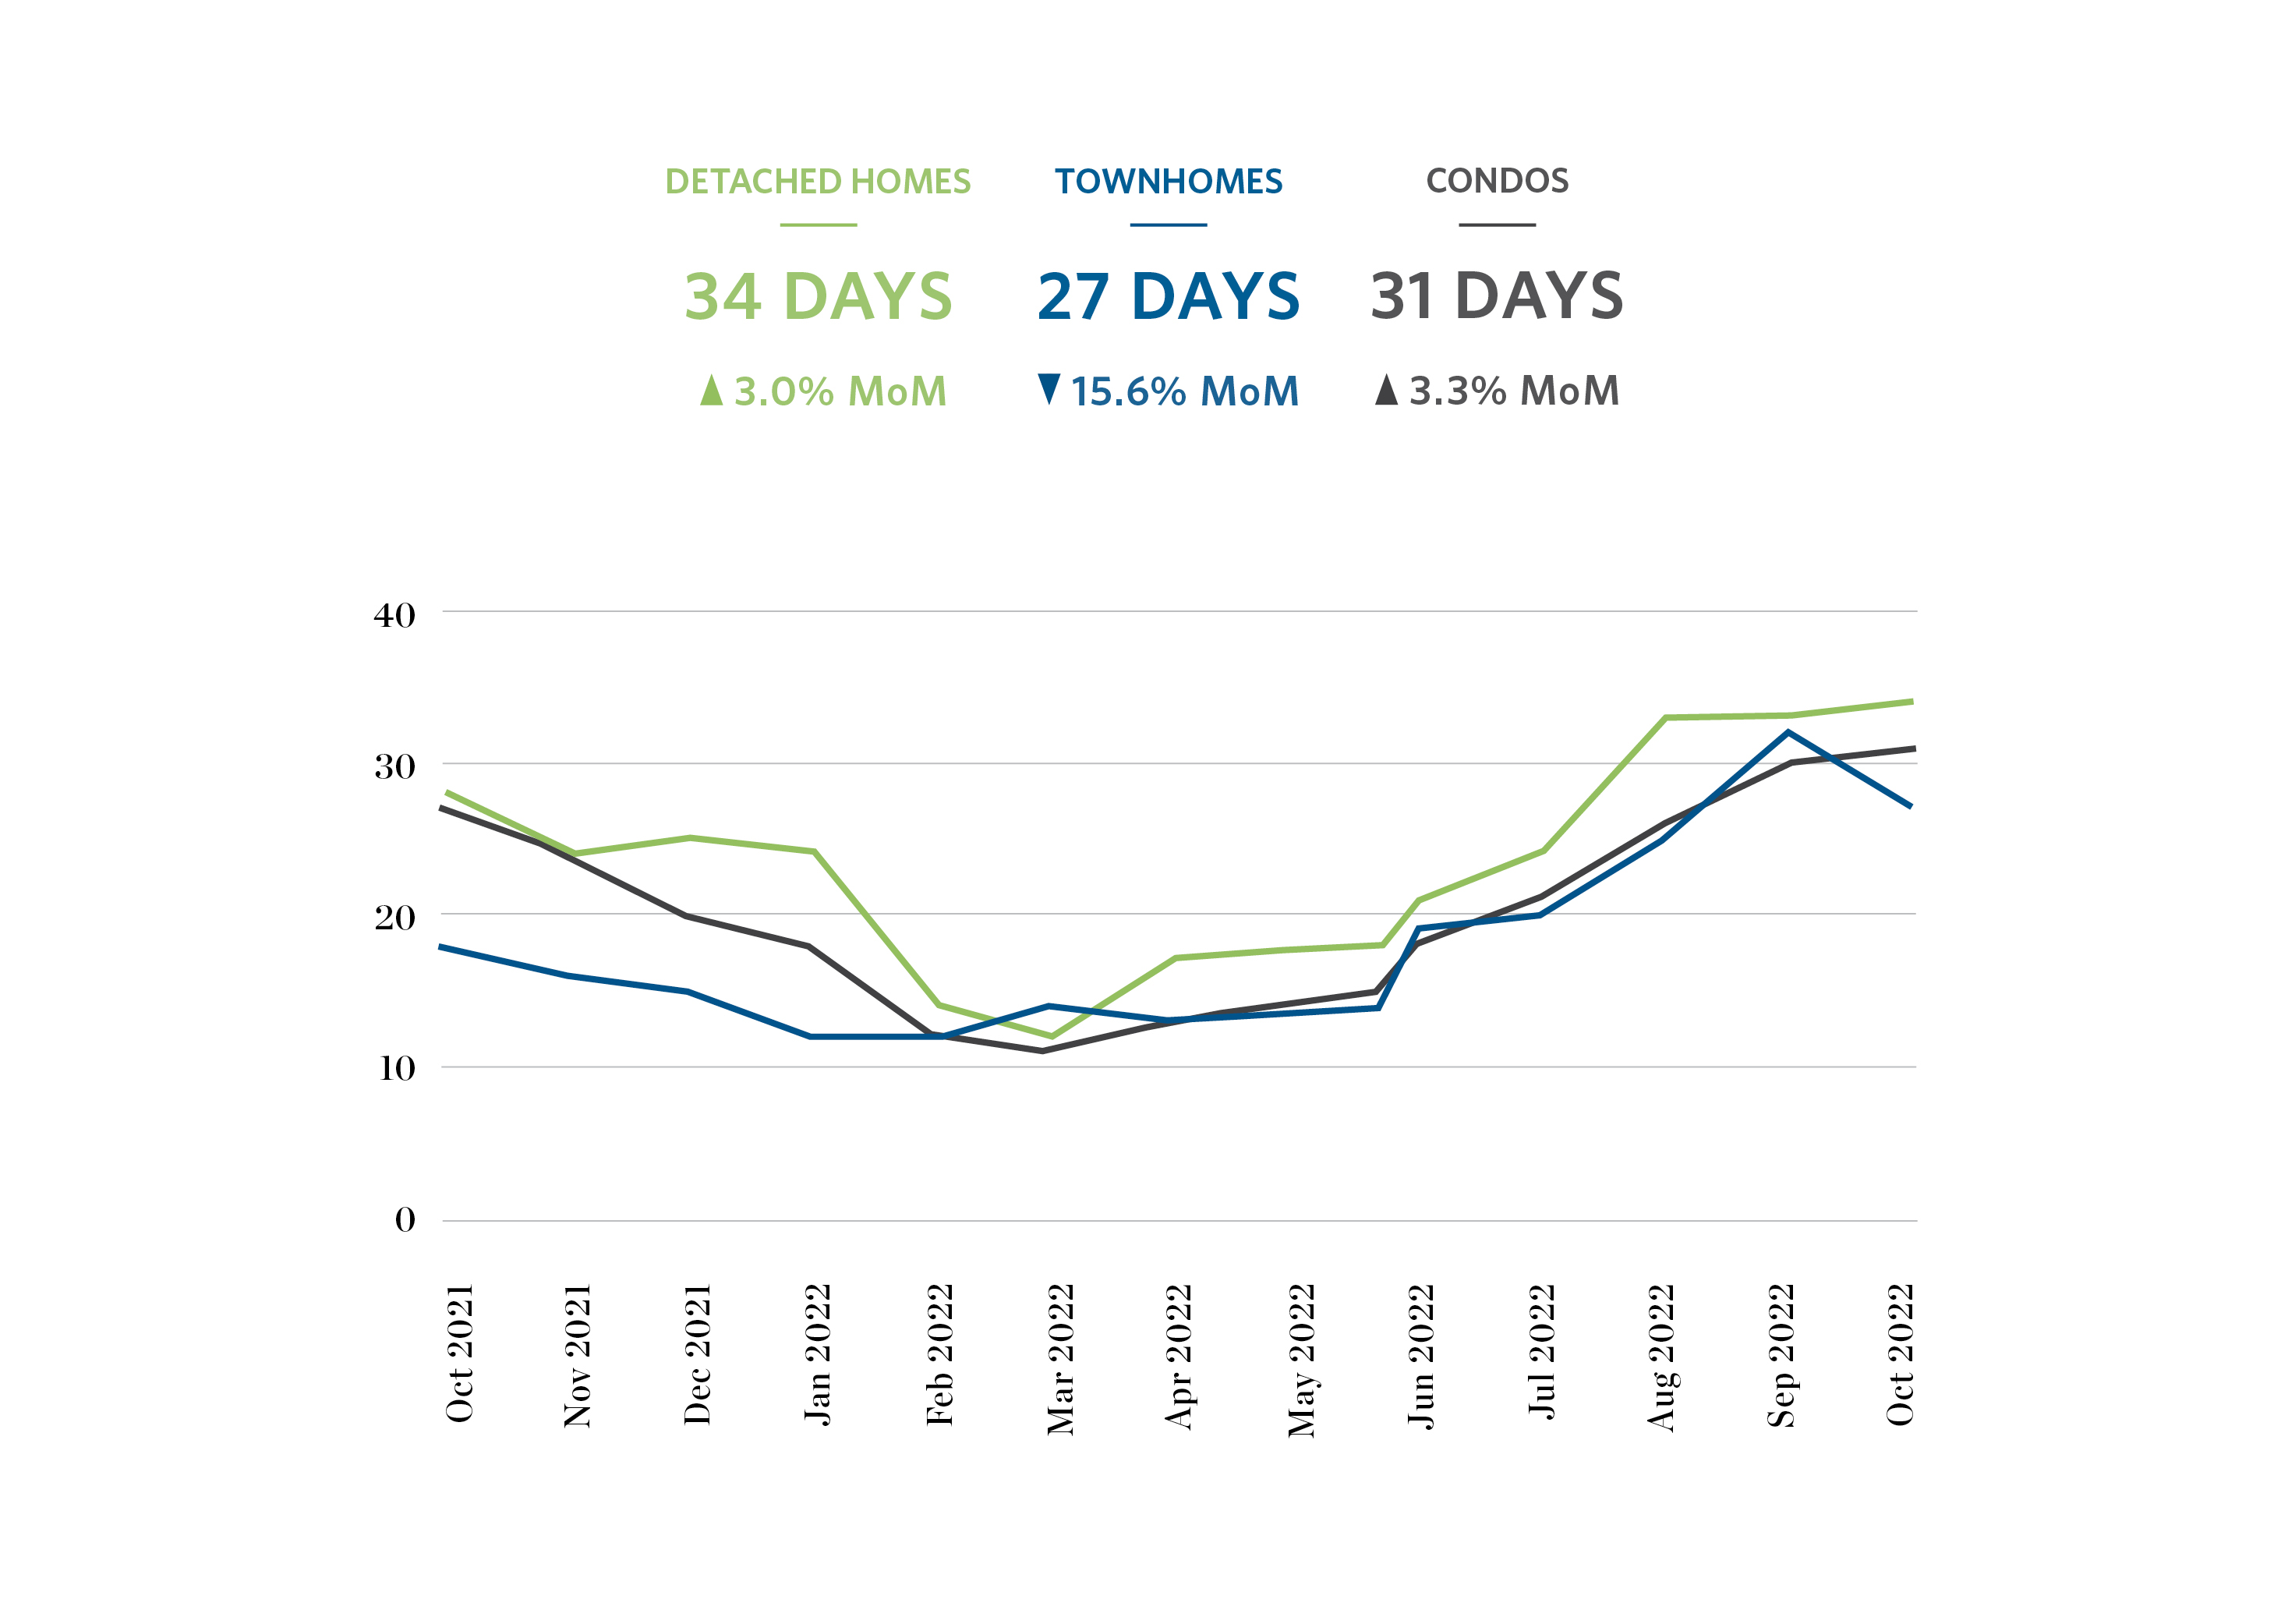
Days on Market
The average days on market continued to increase for detached homes and condos, rising by 3% and 3.3% respectively. Townhomes, however, fell for the first time since March, falling by 15.6%.
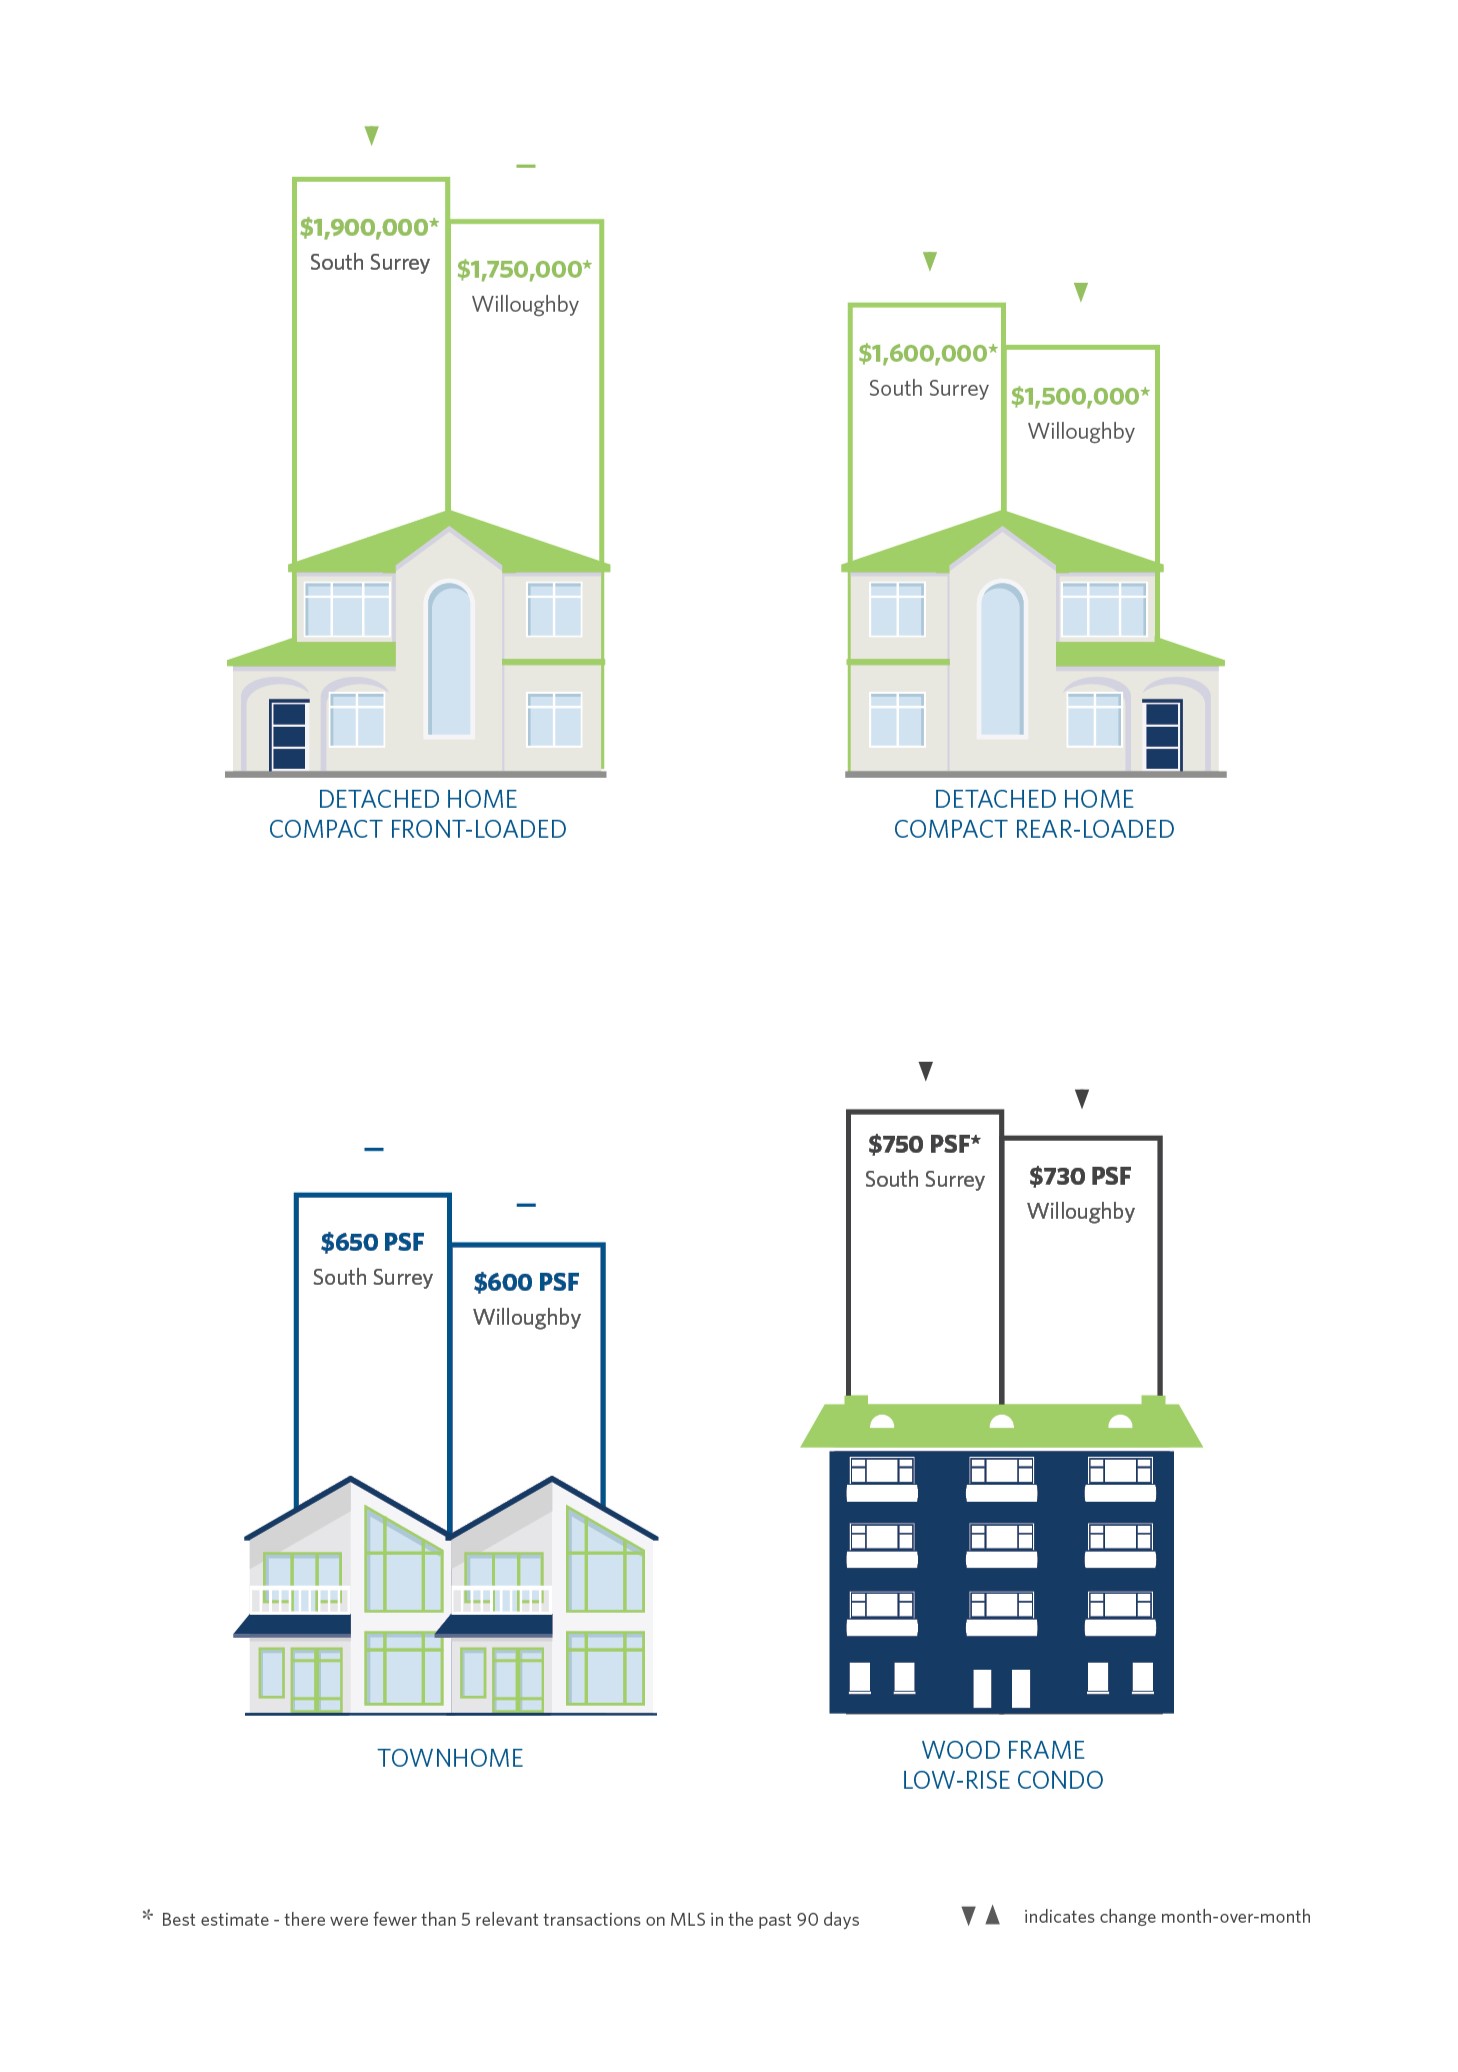
What Are the Sale Prices Of New Homes?
The following values are our opinion of current market revenue figures in two of the most active markets in the Fraser Valley.
The detached home prices are expressed as selling price per home while townhomes and condo prices are expressed as a blended average price per square foot (PSF). All prices reflect a well-executed, well-located project.
Scroll down past our development land update for the rest of the October 2022 statistics in infographics.
WHAT DOES THIS MEAN FOR DEVELOPMENT LAND IN THE FRASER VALLEY?
- Buyers are beginning to come off the sidelines and actively look for sites that fit their parameters.
- The Bank of Canada increased the policy interest rate by 50 basis points and remains resolute in their commitment to restore price stability and achieve a 2% inflation target.
- Due to interest rates and inflation, the lending climate is still one of the most challenging ones we have encountered in a while. It has gotten to the point where it dominates a disproportionate amount of decision-making among buyers.
- The lukewarm sentiment in the land market is beginning to be viewed as an opportunity by more investors & developers who are looking to make an acquisition during the dip of this cycle.
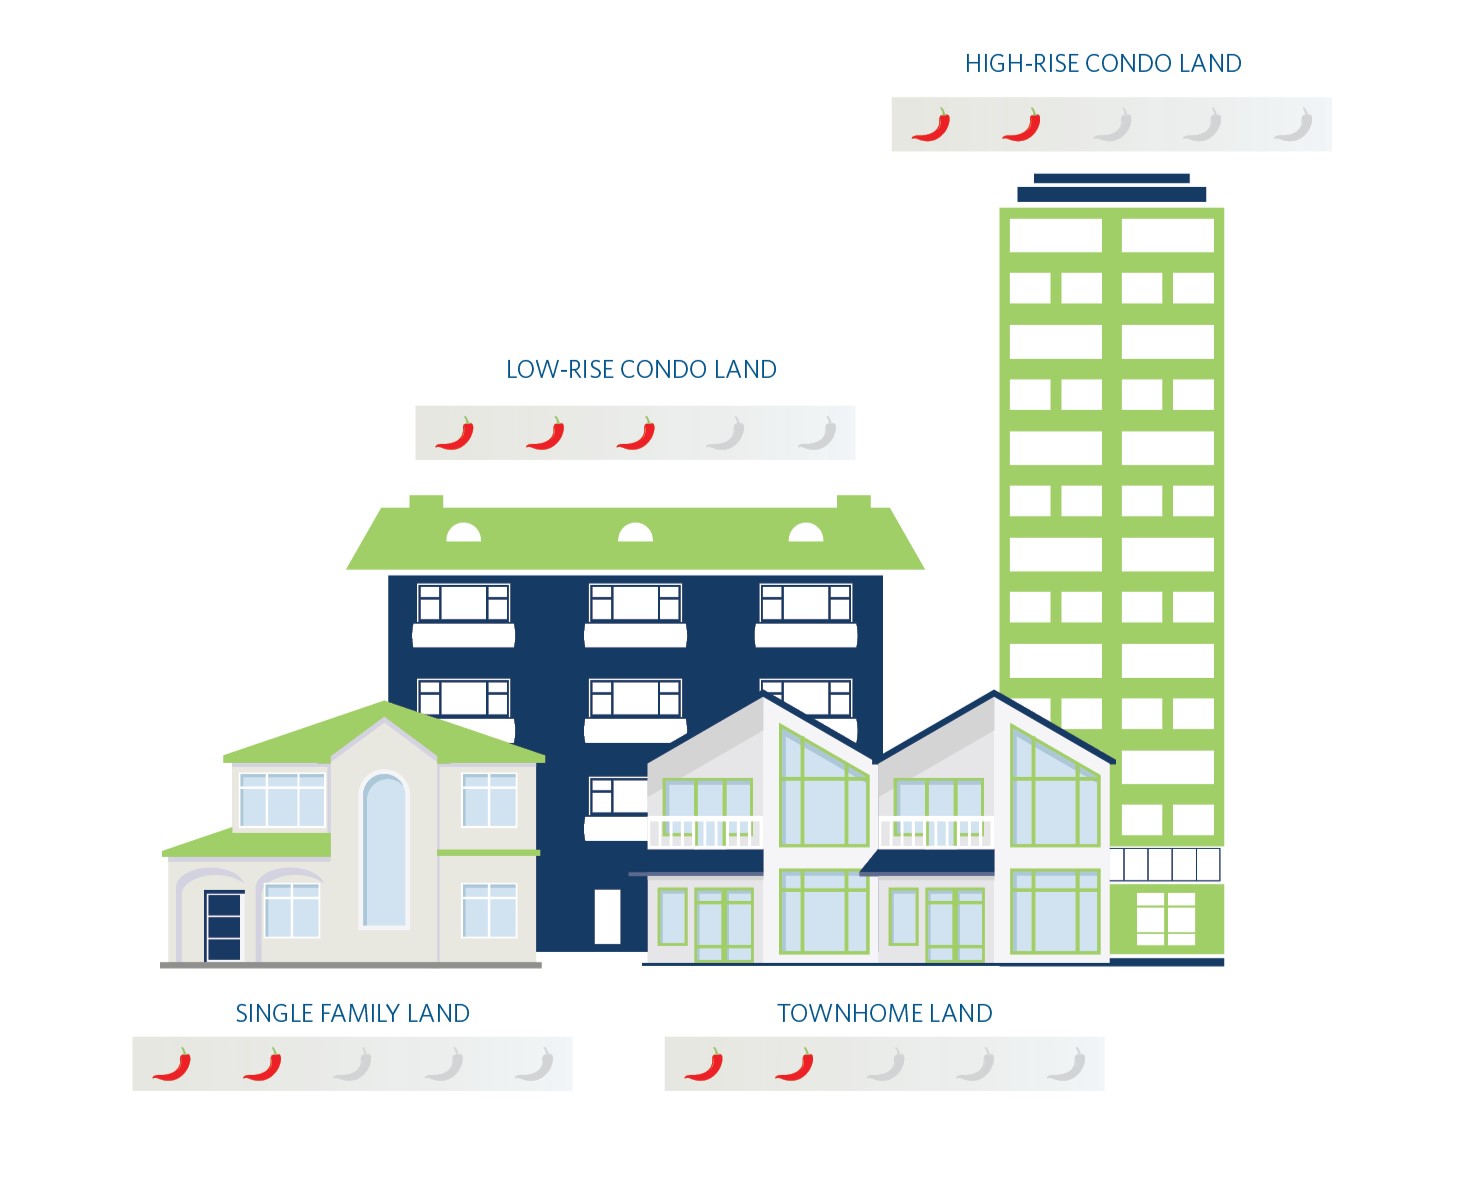
How Hot is the Land Market?
Which segment of Fraser Valley’s residential development land market was the hottest over the last month? This is our opinion based on the volume of acquisition requests from developers, where multiple offers have been received on our listings, and the terms we’re having to include in offers to beat the competition.
The Fraser Valley Real Estate Board OCTOBER 2022 statistics in infographics
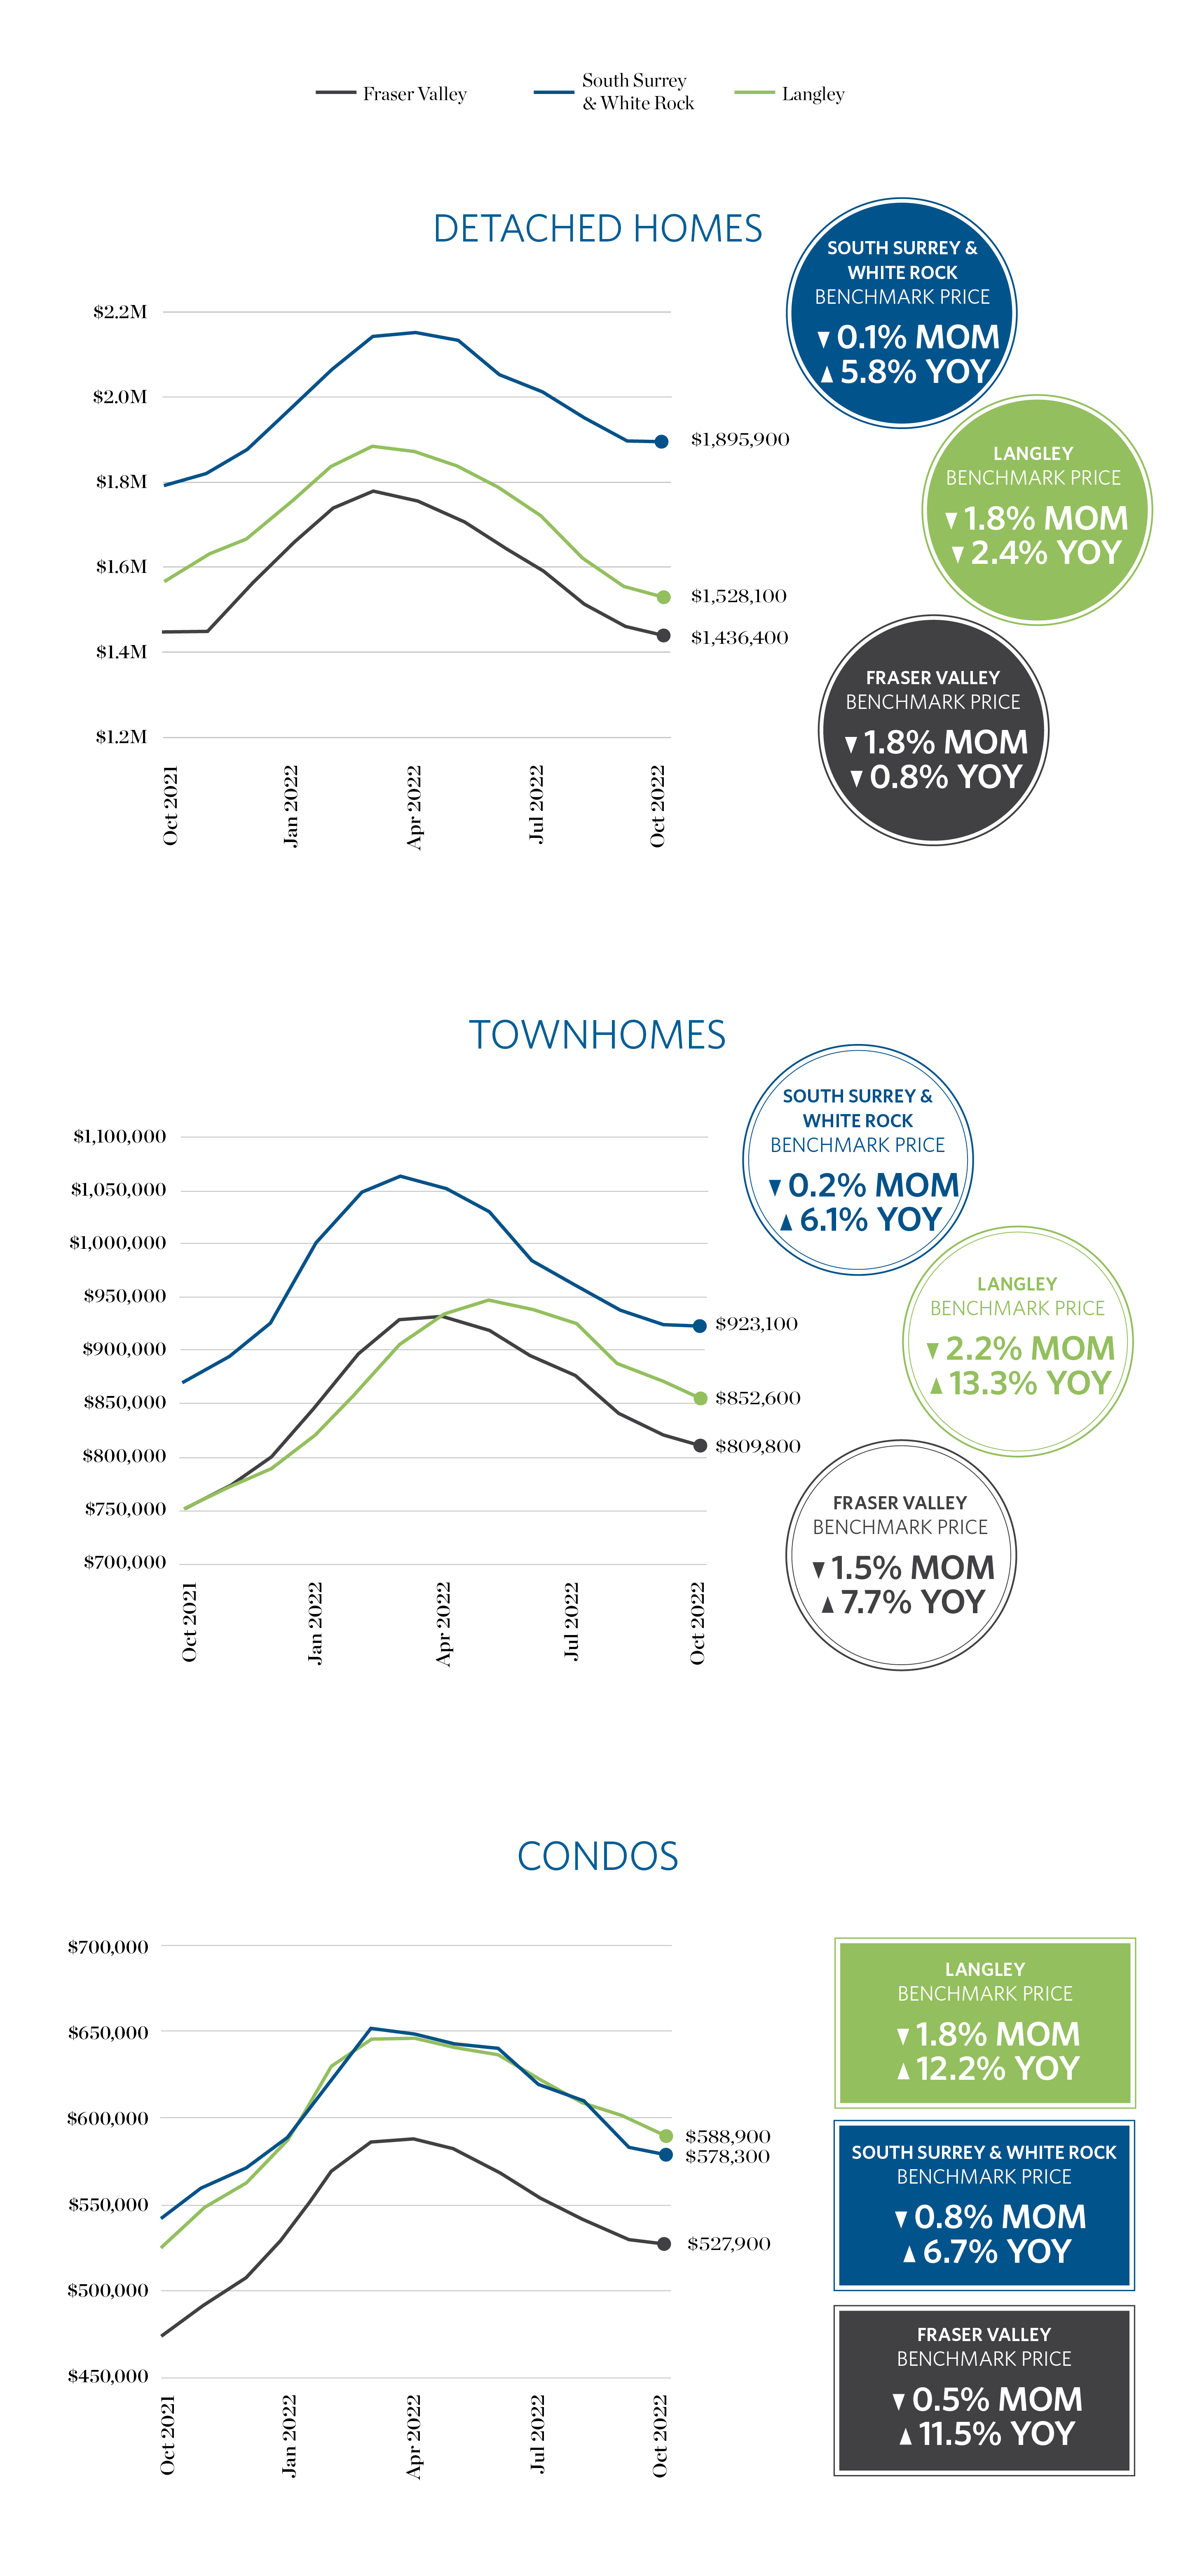
HPI Benchmark Prices
The Home Price Index (HPI) measures the price of a benchmark, or typical, property in a given market and is not influenced by the change in composition of properties sold, which can fluctuate quite significantly from month to month. As a result, this metric is a more pure and stable representation of market price change than average or median prices.
Benchmark prices were marginally lower month-over-month across all property types as prices continued to decline, however prices for detached homes were at steady year-over-year, while townhome and apartment prices were up 7.7% and 11.50%, respectively.
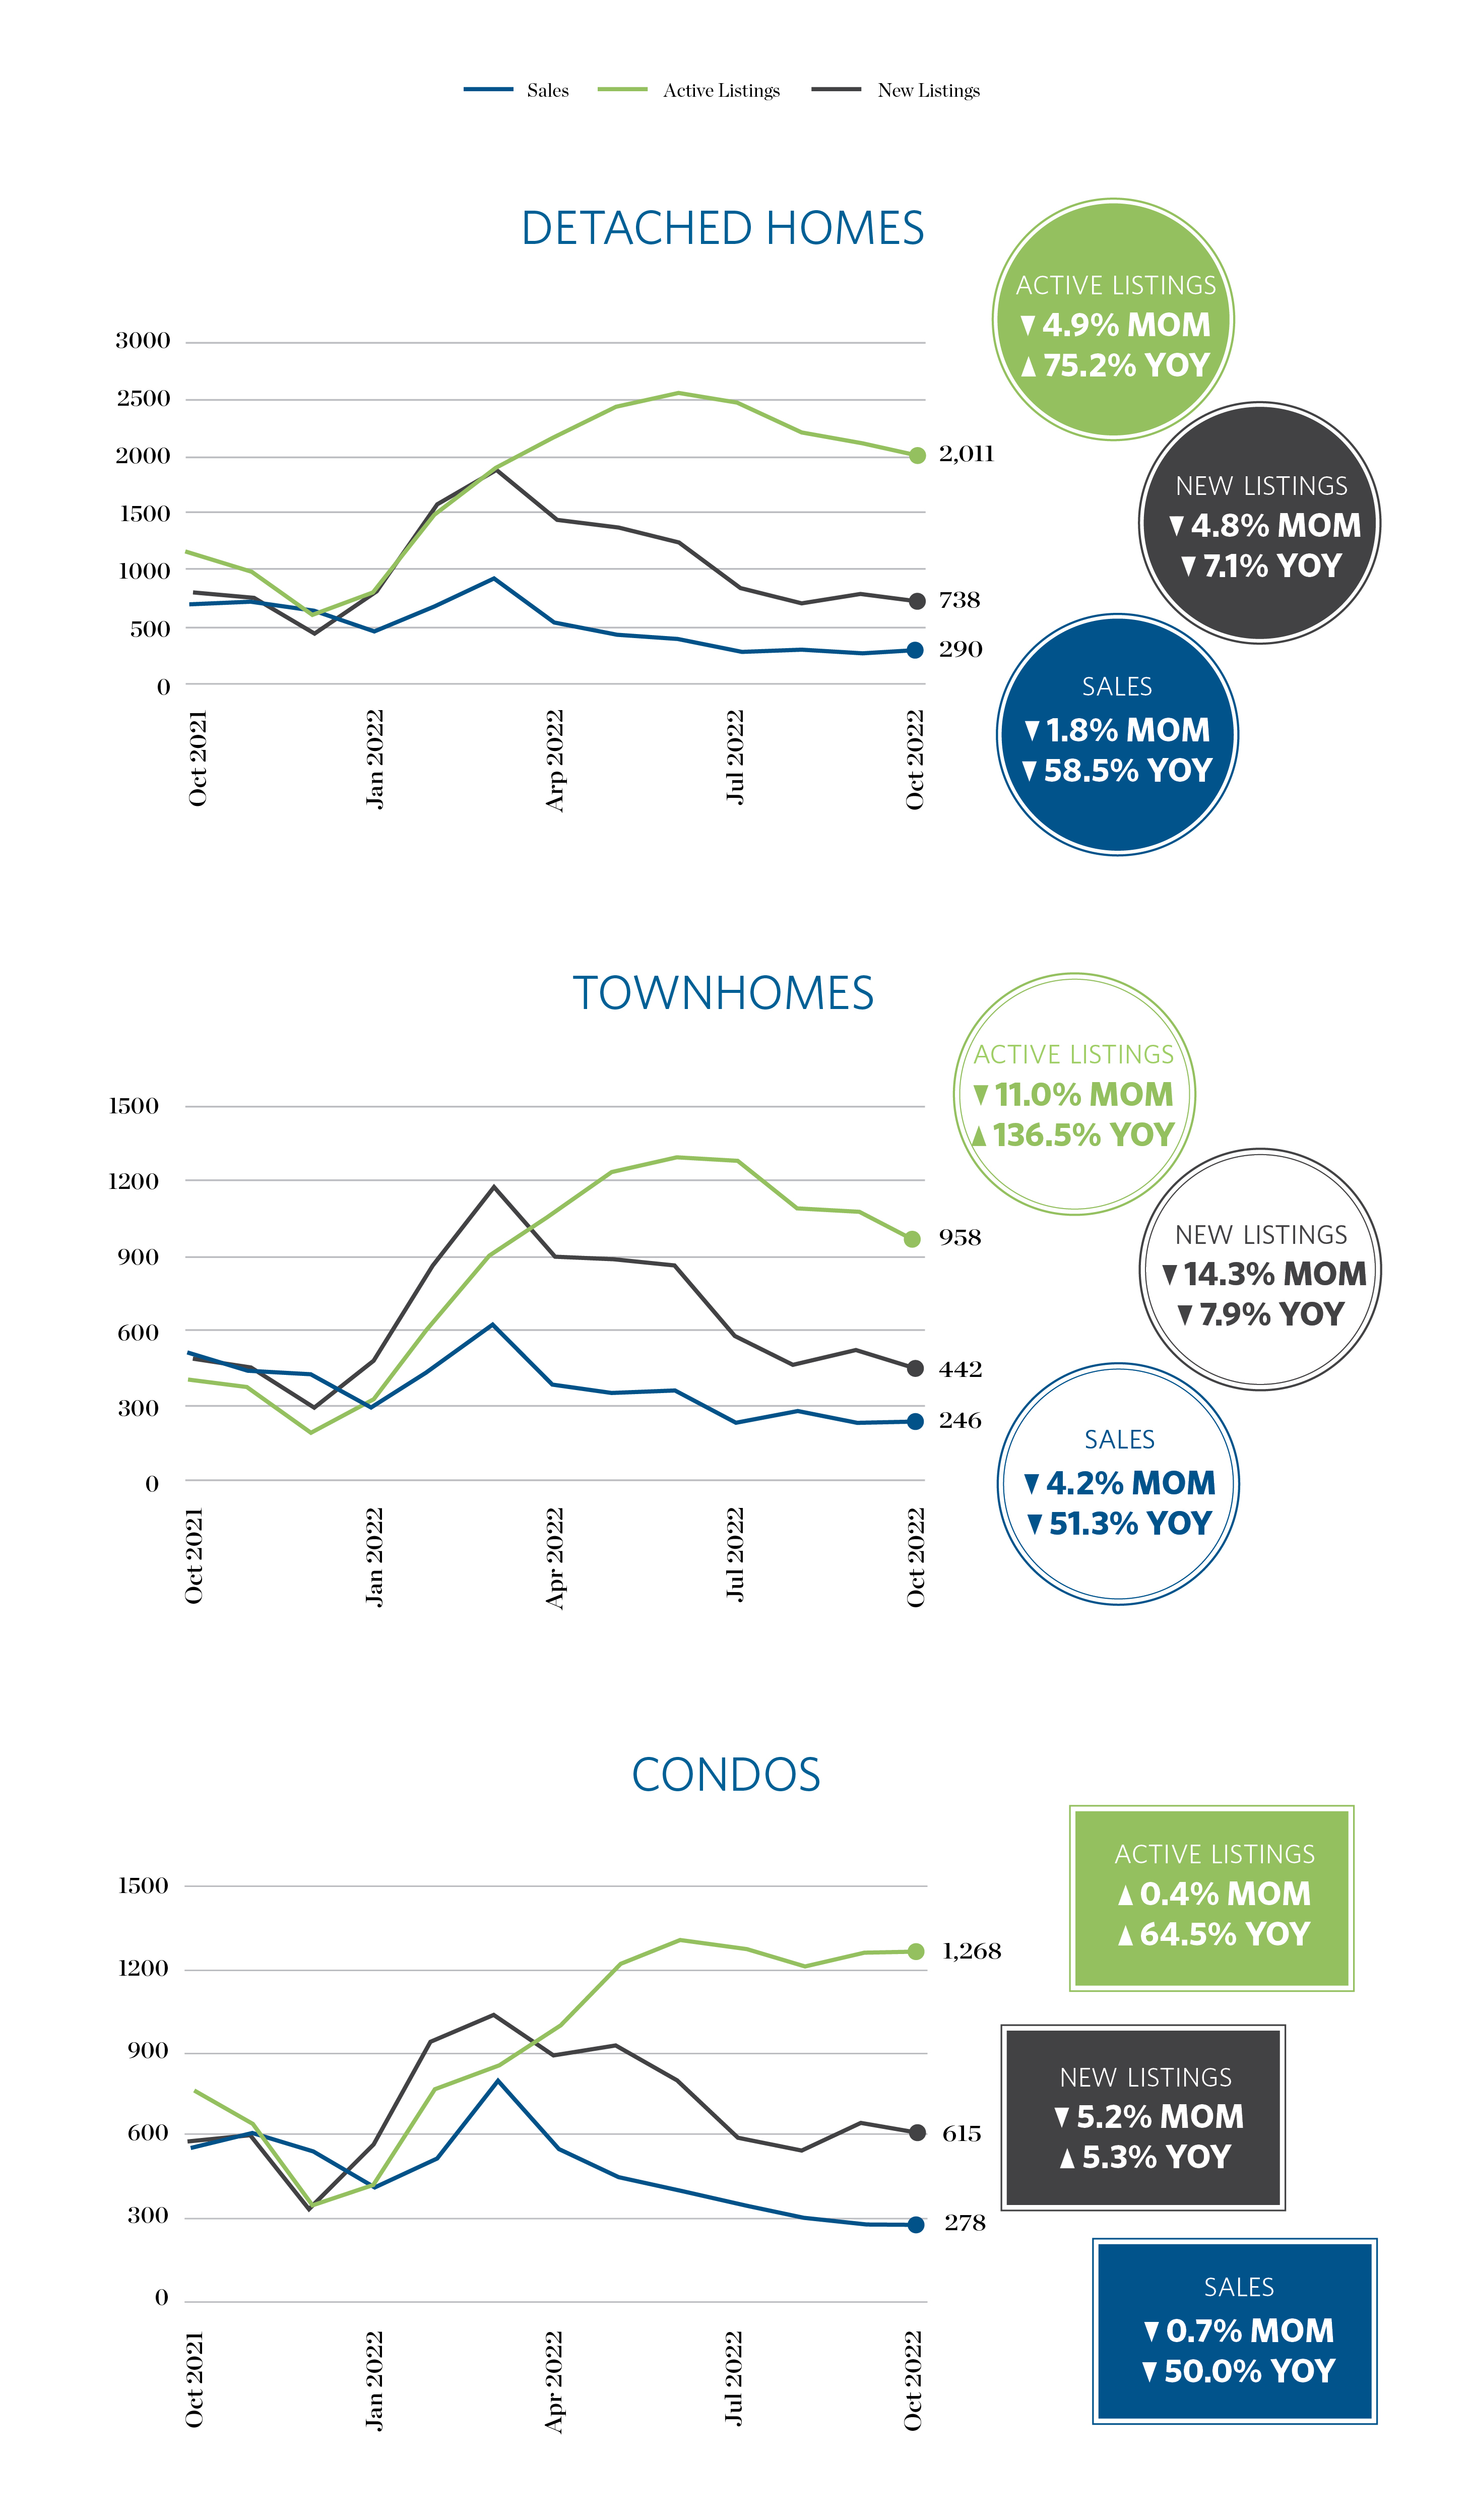
Sales • New Listings • Active Listings
New listings decreased across all product types yet again, which highlights that the previous month’s increase was indeed an anomaly. At the end of the month, active listings for townhomes and detached homes were 11% and 4.9% below the previous month, whereas condos were up 0.4%. Meanwhile, sales remain 50% – 58.5% below last year’s figures (depending on product type).
We are currently witnessing a holding pattern from both buyers and sellers and expect this to continue through year’s end. This is due to, but also causing, sales to continue to lag and a reluctance of new inventory to come onstream.
October in Quotes
“These trends suggest that the market is looking to re-establish equilibrium in the wake of last year’s intense activity and in the face of continued interest rate pressures.”
- Sandra Benz, President of Fraser Valley Real Estate Board
“With sales continuing to lag and new inventory slow to come onstream, we’re seeing a holding pattern regarding whether to buy or list a property and expect this to continue through to year-end.”
- Sandra Benz, President of Fraser Valley Real Estate Board
“With interest rates at their highest levels since 2006, it’s understandable that buyers and sellers are hesitant.”
- Baldev Gill, CEO of Fraser Valley Real Estate Board
Further Reading
View the Fraser Valley Real Estate Board’s entire stats package for October 2022 here.
Sources
Sources: Breakside Real Estate Group, New Home Source, Fraser Valley Real Estate Board
This representation is based in whole or in part on data generated by the Fraser Valley Real Estate Board which assumes no responsibility for its accuracy. E.&O.E: This document/communication has been prepared by Frontline Real Estate Services Ltd. (“Frontline”) for advertising and general information only. Frontline makes no representations or warranties, express or implied, regarding the information including, as to its accuracy or reliability.
