Infographic: Greater Vancouver Residential Real Estate January 2023
Home sales in Metro Vancouver have dropped significantly below historical averages to kick off the year. Low inventory and rising mortgage rates continued to impact the market in January, but the Bank of Canada has announced a pause on rate increases which may provide more stability for buyers and sellers moving forward.
These residential market statistics from the Real Estate Board of Greater Vancouver provide insight into the current state of the residential home market, including home values, which directly impact the development land market. Contact us today if you would like to learn what your property is worth on the development land market.
GREATER VANCOUVER January 2023 FEATURED Residential Market STATISTICS
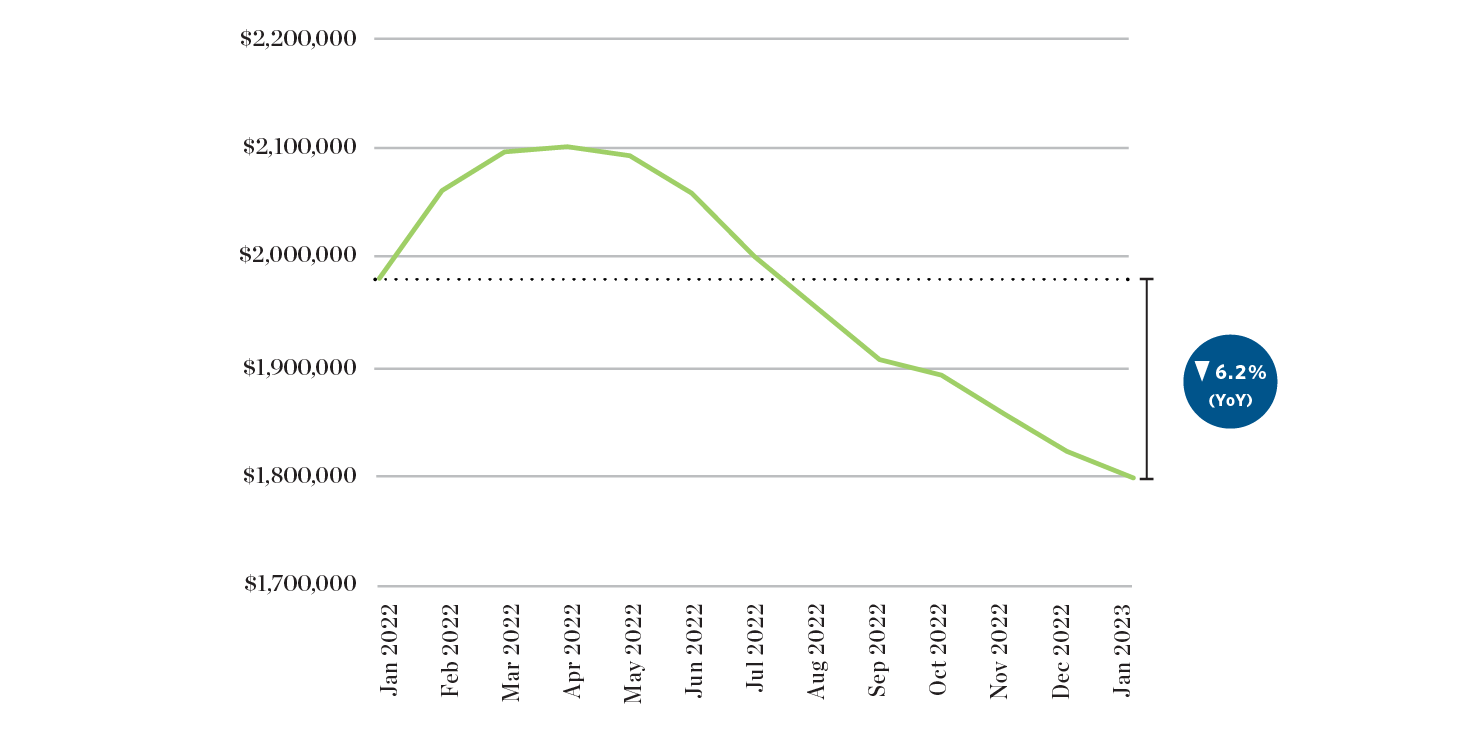
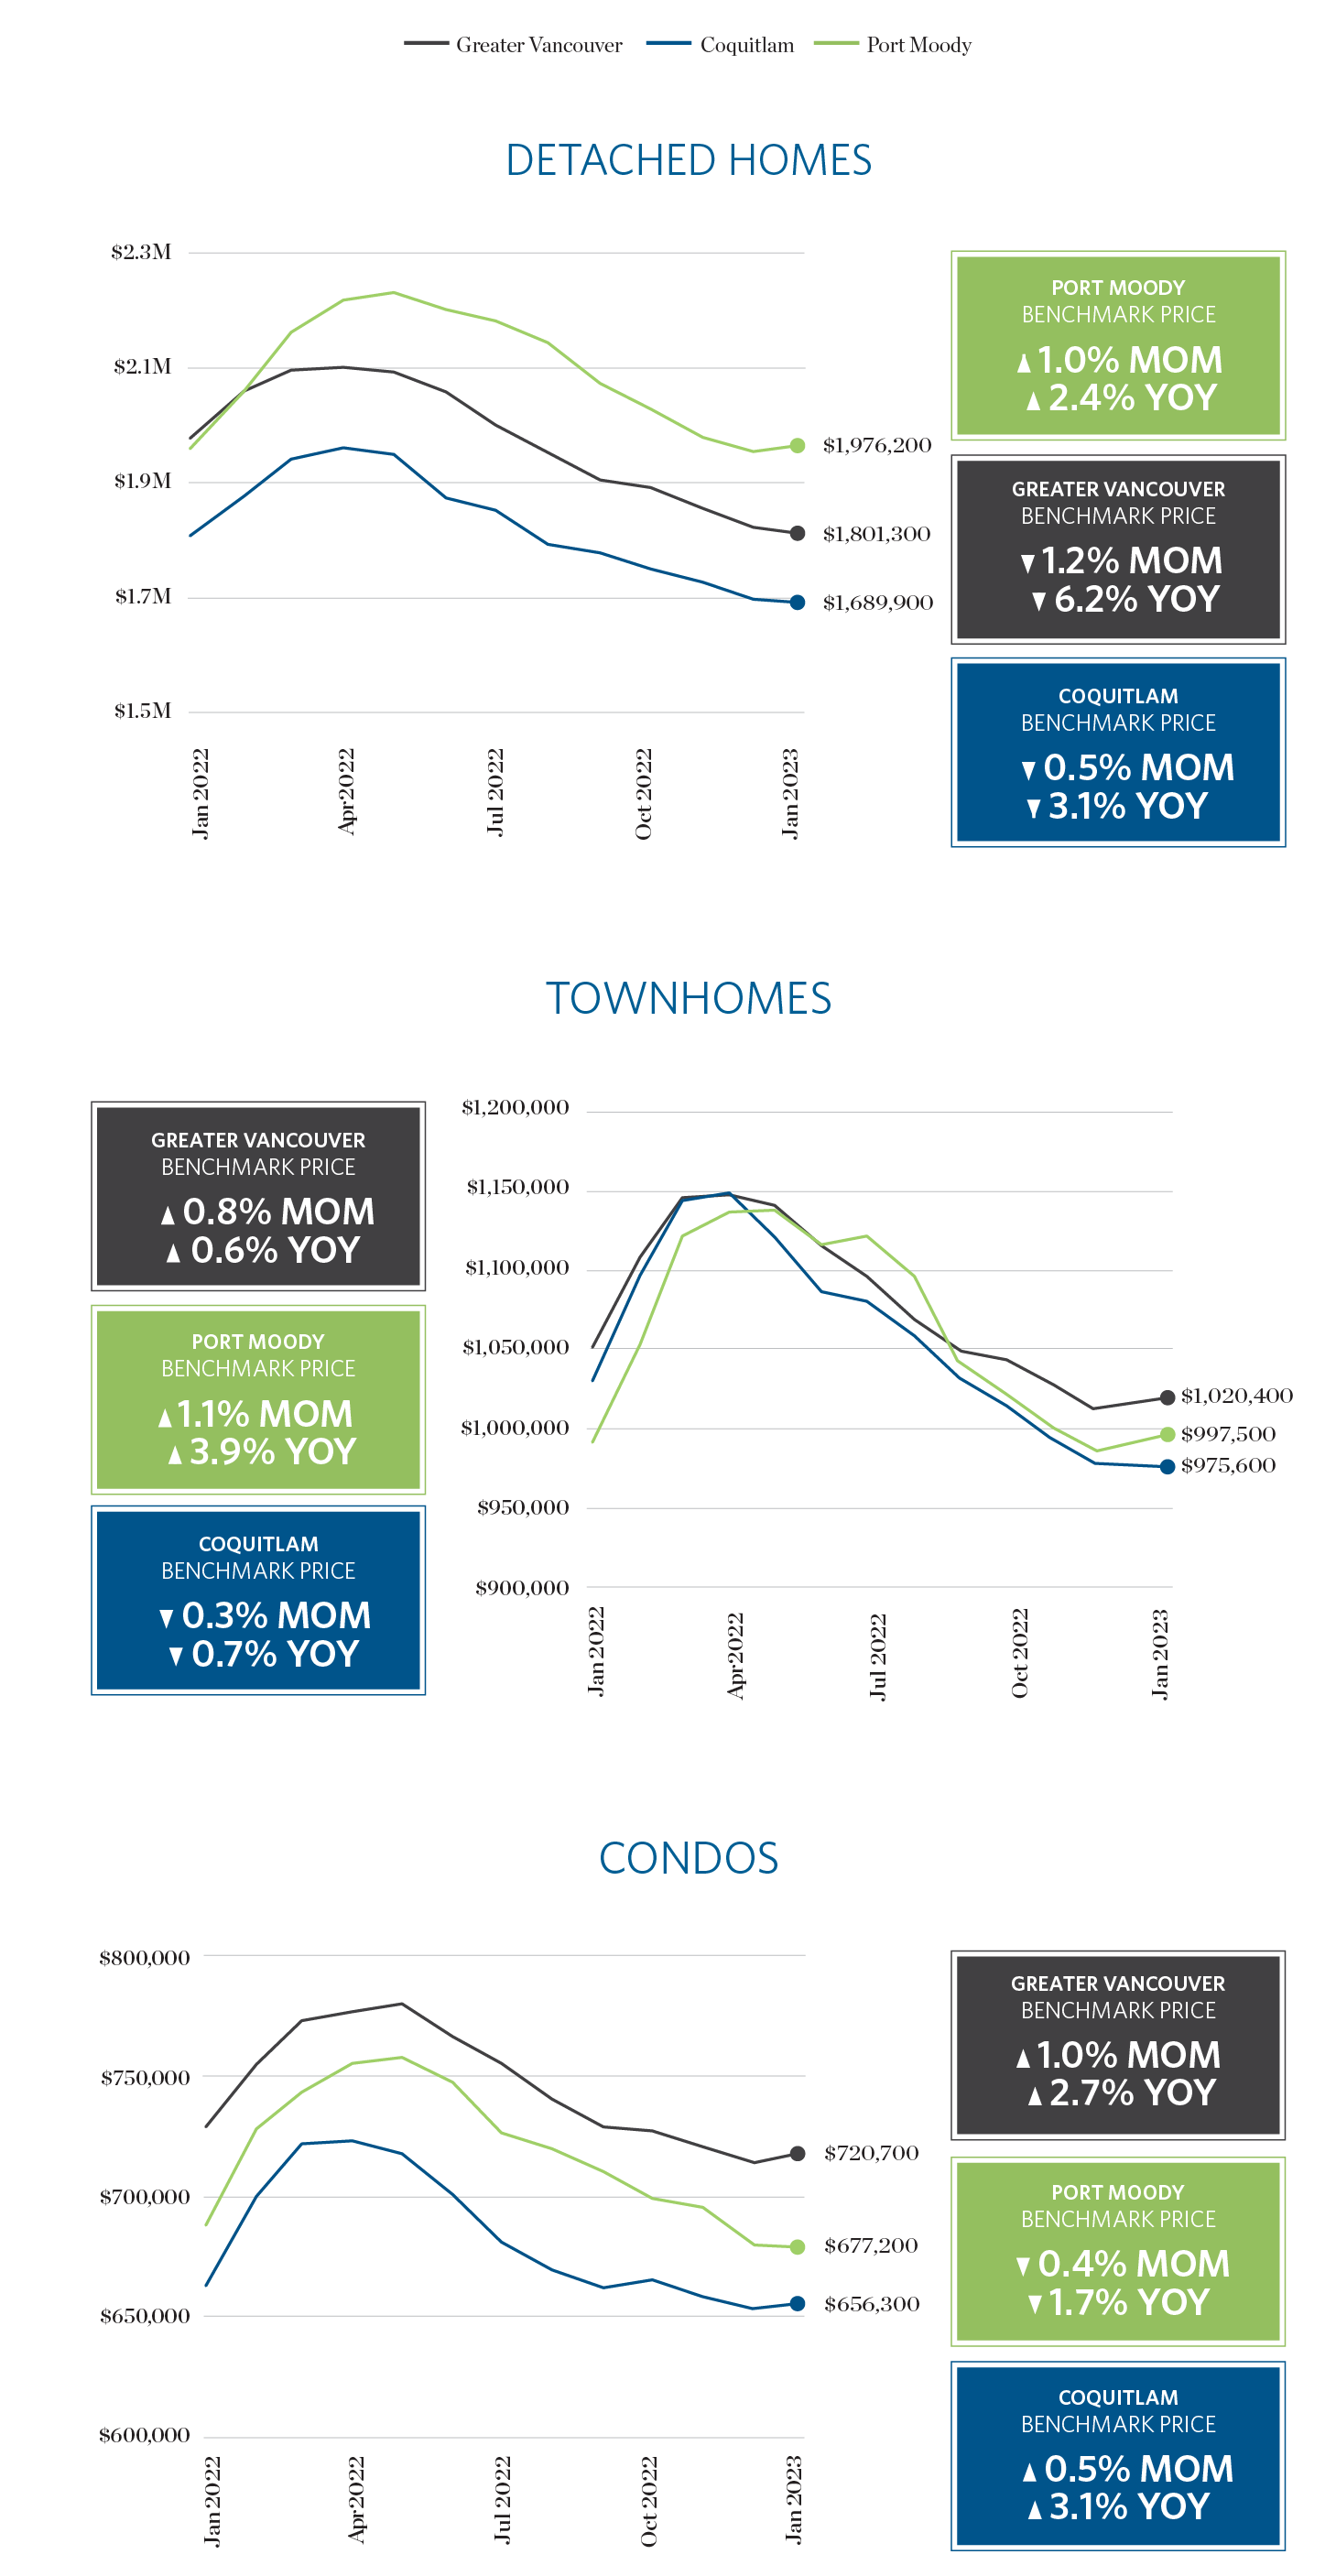
HPI Benchmark Price of Detached Homes
The benchmark price of detached homes continued its downward trend, following last month.
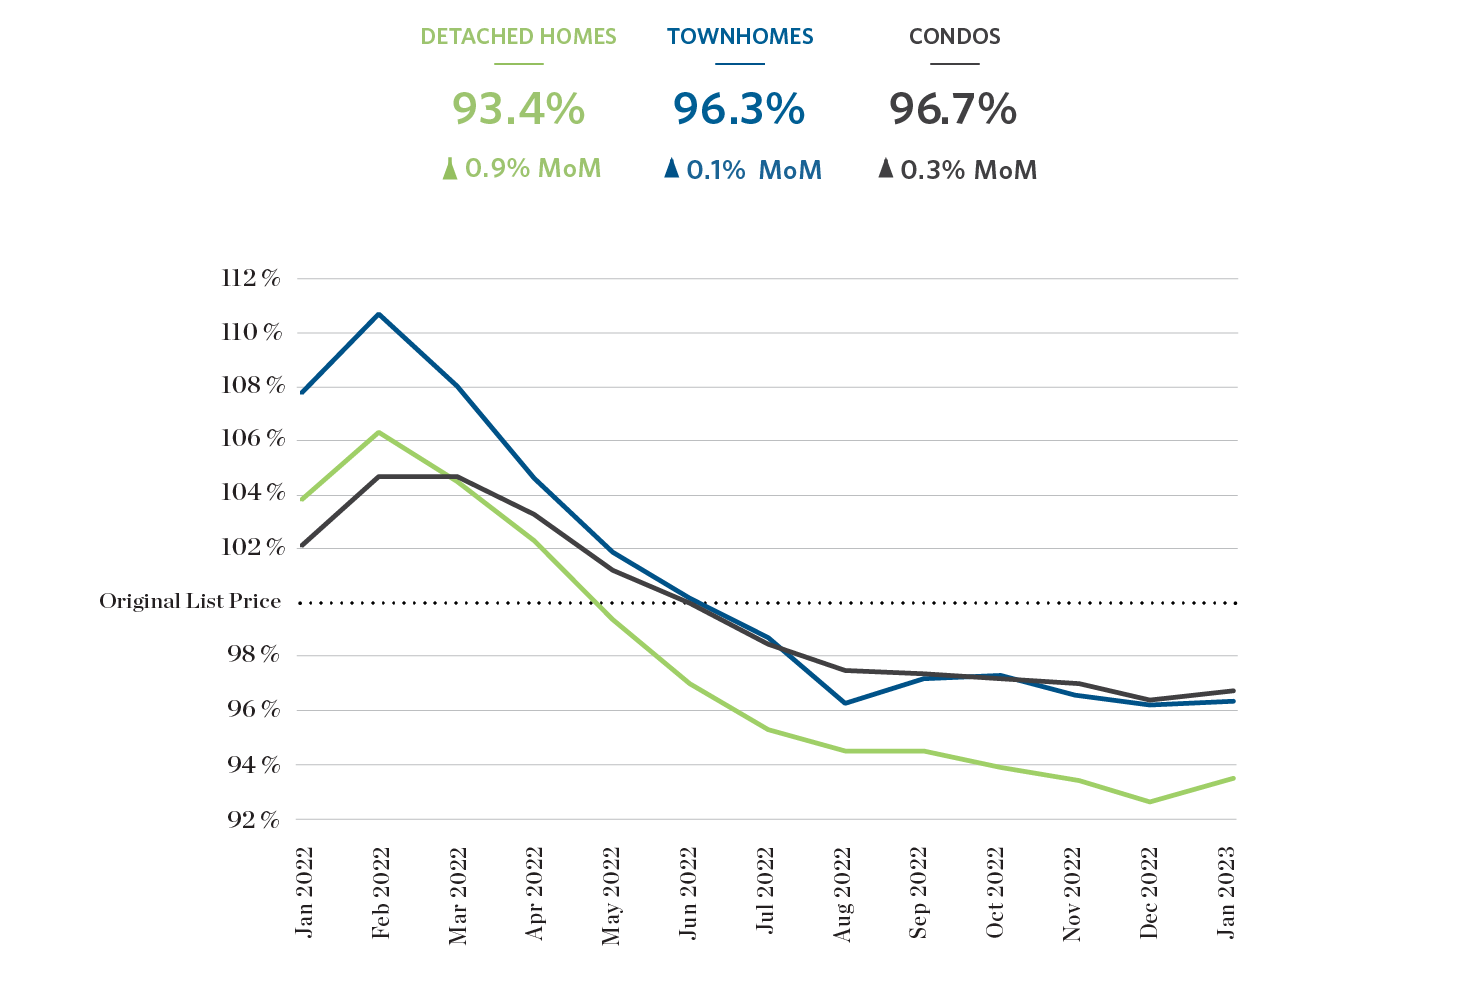
Sale Price As a Percent of Original List Price
The average percent of original sale price continues to stabilize with minimal changes, following last months trend.
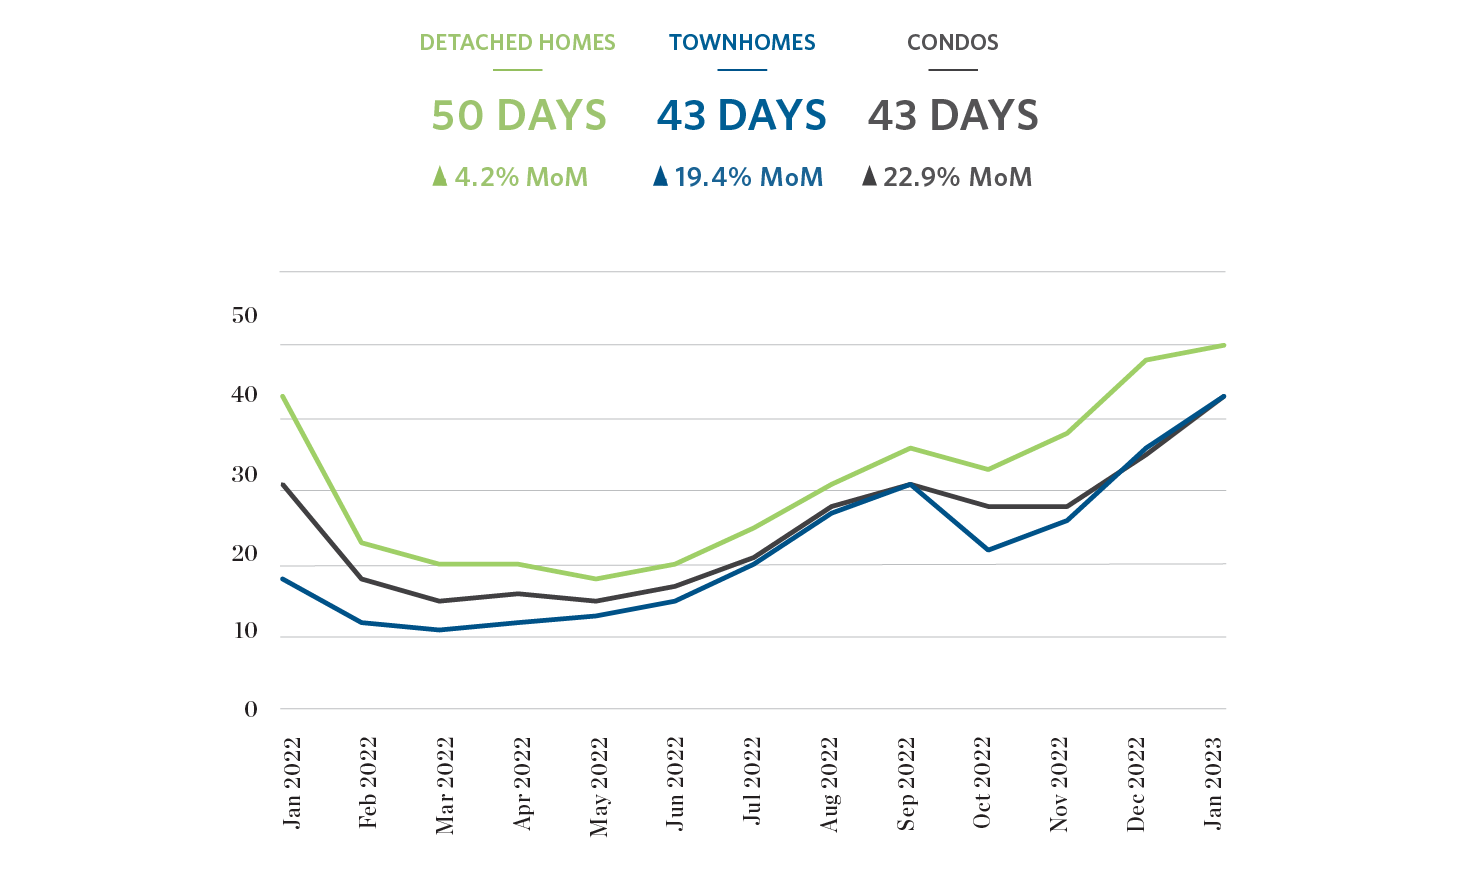
Days on Market
The average days on market for all product types in Metro Vancouver increased in January. The largest increase was seen in the average days on market for condos, which went up by 22.9%.
Featured Homes
Looking for a new home? Check out these featured new homes courtesy of our affiliate company, Breakside Real Estate Group.
GREATER VANCOUVER RESIDENTIAL REAL ESTATE: JANUARY 2023 statistics in infographics
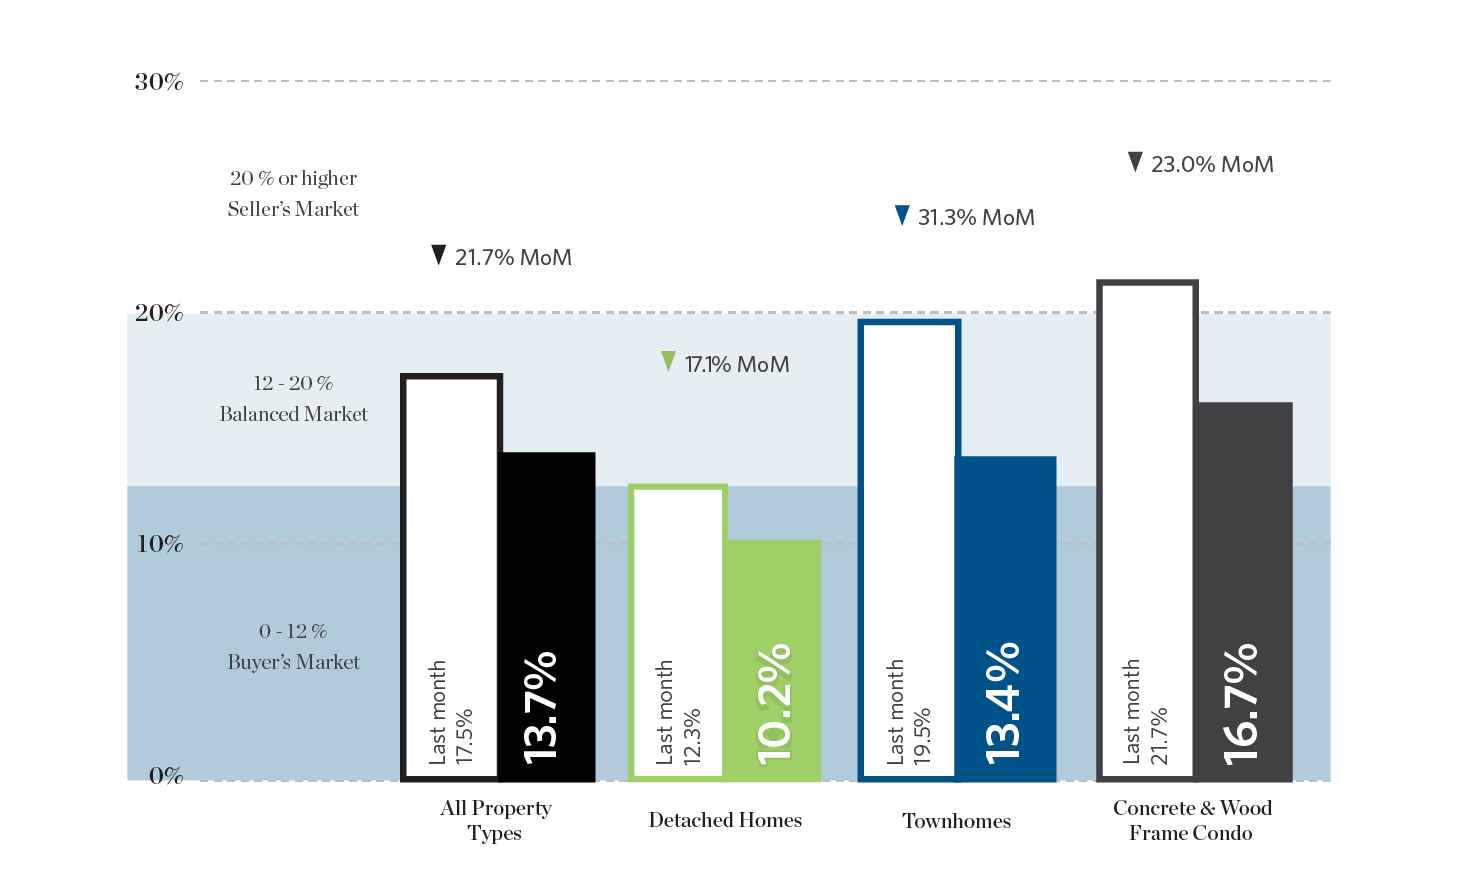
Sales To Active Listings Ratio
The sales to active listings ratio for all property types experienced some significant changes in January, leading townhomes and condos from a buyer’s market (or close to) back to a more balanced market. Detached homes on the other hand officially entered into a buyers market.
HPI Benchmark Prices
The Home Price Index (HPI) measures the price of a benchmark, or typical, property in a given market and is not influenced by the change in composition of properties sold, which can fluctuate quite significantly from month to month. As a result, this metric is a more pure and stable representation of market price change than average or median prices.
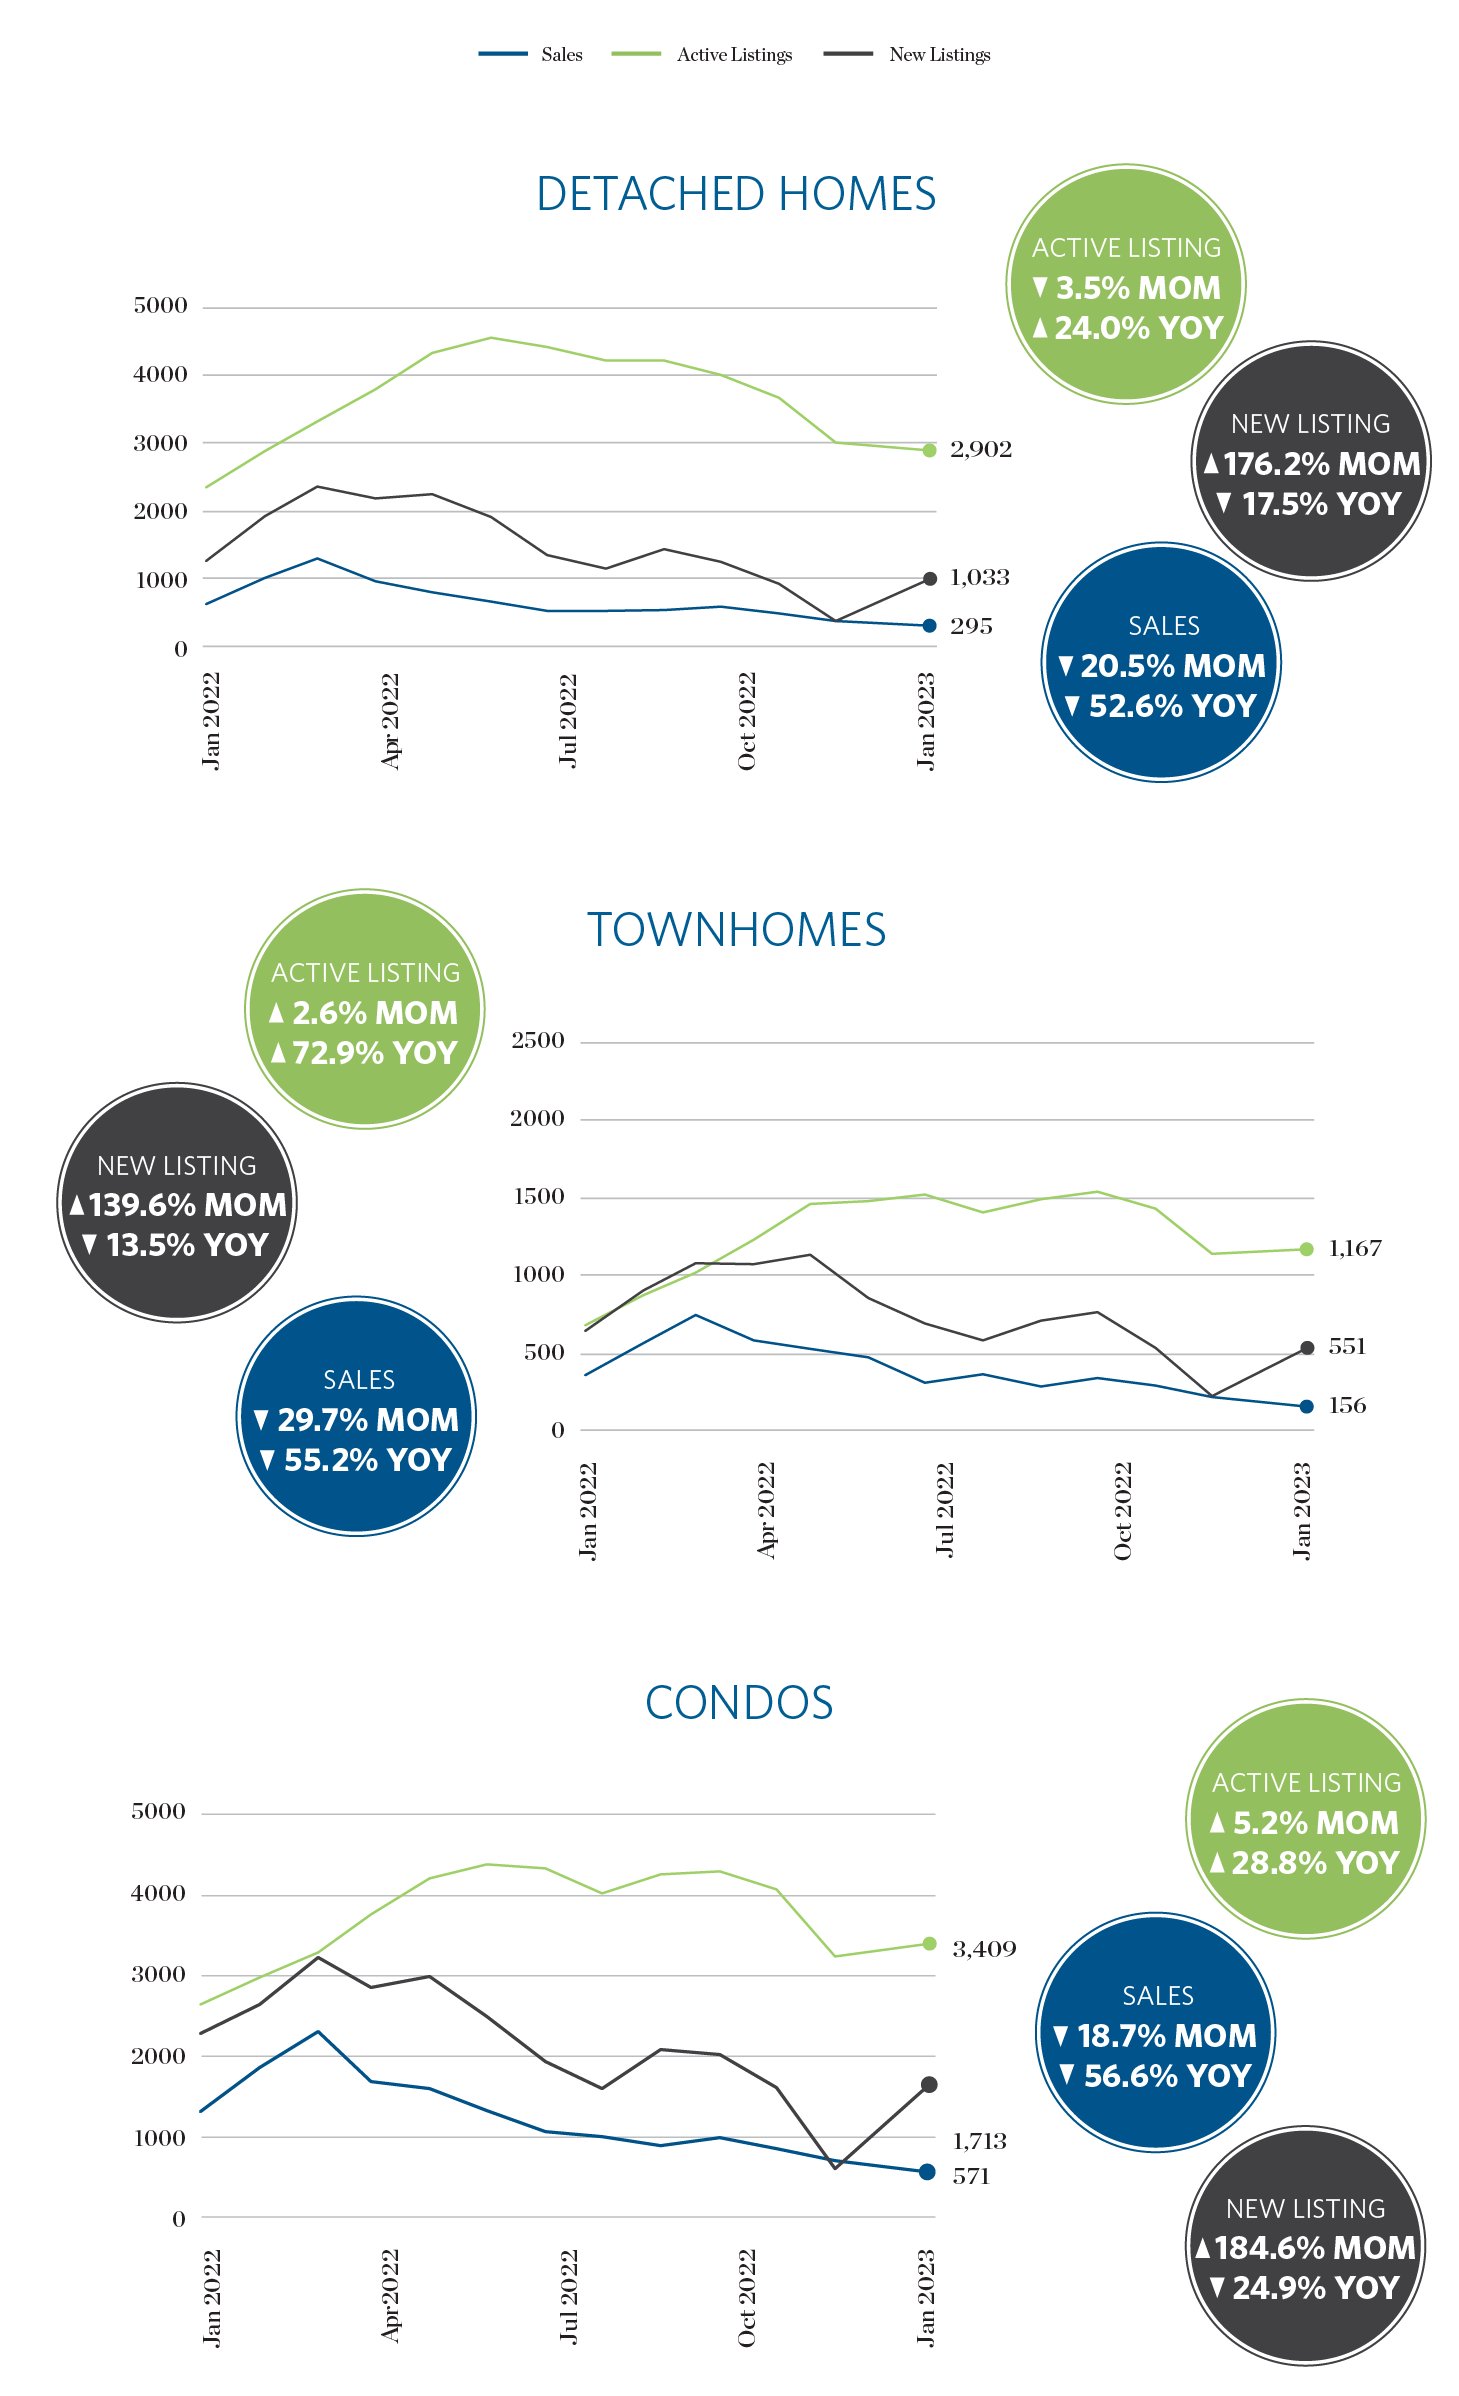
Sales • New Listings • Active Listings
There was a 150% month-over-month increase in newly listed properties to start the new year, which isa positive trend. However, new listings were still well below levels from the same period in 2022. Decreasing sales continued in January, following the same trend as we experienced late last year.
Further Reading
View the Real Estate Board of Vancouver’s entire stats package for January 2023 here.
Sources
Sources: Breakside Real Estate Group, Real Estate Board of Greater Vancouver
This representation is based in whole or in part on data generated by the Real Estate Board of Greater Vancouver which assumes no responsibility for its accuracy.
![Rendering of 85 at Scott Rd, a 4 story condo building with retail on the bottom floor. Tex reads: Now selling. 85 at Scott Road. A boutique condo building located at Scott Road and 85 Avenue. Click here to learn more. Breakside Real Estate Group [logo].](https://flre.ca/drive/uploads/2023/02/Featured-Project-Call-Out-85atScottRoad-Feb2023.jpg)
![Photo of modern kitchen at Heath. Text reads: Now selling. Heath Yorkson, Langley. A boutique collection of townhomes in Langley's Yorkson Neighbourhood. Click here to learn more. Breakside Real Estate Group [logo].](https://flre.ca/drive/uploads/2023/02/Featured-Project-Call-Out-Heath-Feb2023.jpg)
![Rendering of the exterior of Southaven, a condo building with large window, balconies, and lanscaping. Text reads: Coming soon. Southaven. A refined collection of modern 1 and 2 bedroom condominium residences situated in the coveted Elgin neighbourhood in South Surrey. Click here to learn more. Breakside Real Estate Group [logo].](https://flre.ca/drive/uploads/2023/02/Featured-Project-Call-Out-Southaven-Feb2023-1.jpg)
