Infographic: Greater Vancouver Residential Real Estate March 2023
The Metro Vancouver housing market saw modest price increases in March, with home sales making a stronger than expected spring showing, despite elevated borrowing costs. However, new listings remained below long-term historical averages.
These residential market statistics from the Real Estate Board of Greater Vancouver provide insight into the current state of the residential home market, including home values, which directly impact the development land market. Contact us today if you would like to learn what your property is worth on the development land market.
GREATER VANCOUVER MARCH 2023 FEATURED Residential Market STATISTICS
- The total number of homes newly listed for sale in March 2023 decreased by 35.5% compared to the same period last year. This suggests that sellers are awaiting more favorable market conditions. For homeowners, this may mean holding onto their property for longer, potentially resulting in reduced liquidity.
- Home prices in Metro Vancouver are on track to exceed 2023’s modest forecasts, despite elevated borrowing costs and below-average sales. This indicates a potential opportunity for sellers in the current market. This trend may lead to a seller’s market, providing a favorable environment for sellers to capitalize on current market conditions.
- The sales-to-active listings ratio for all property types remained above the 12% threshold for sustained downward pressure on home prices, indicating that prices may experience upward pressure in the coming months.
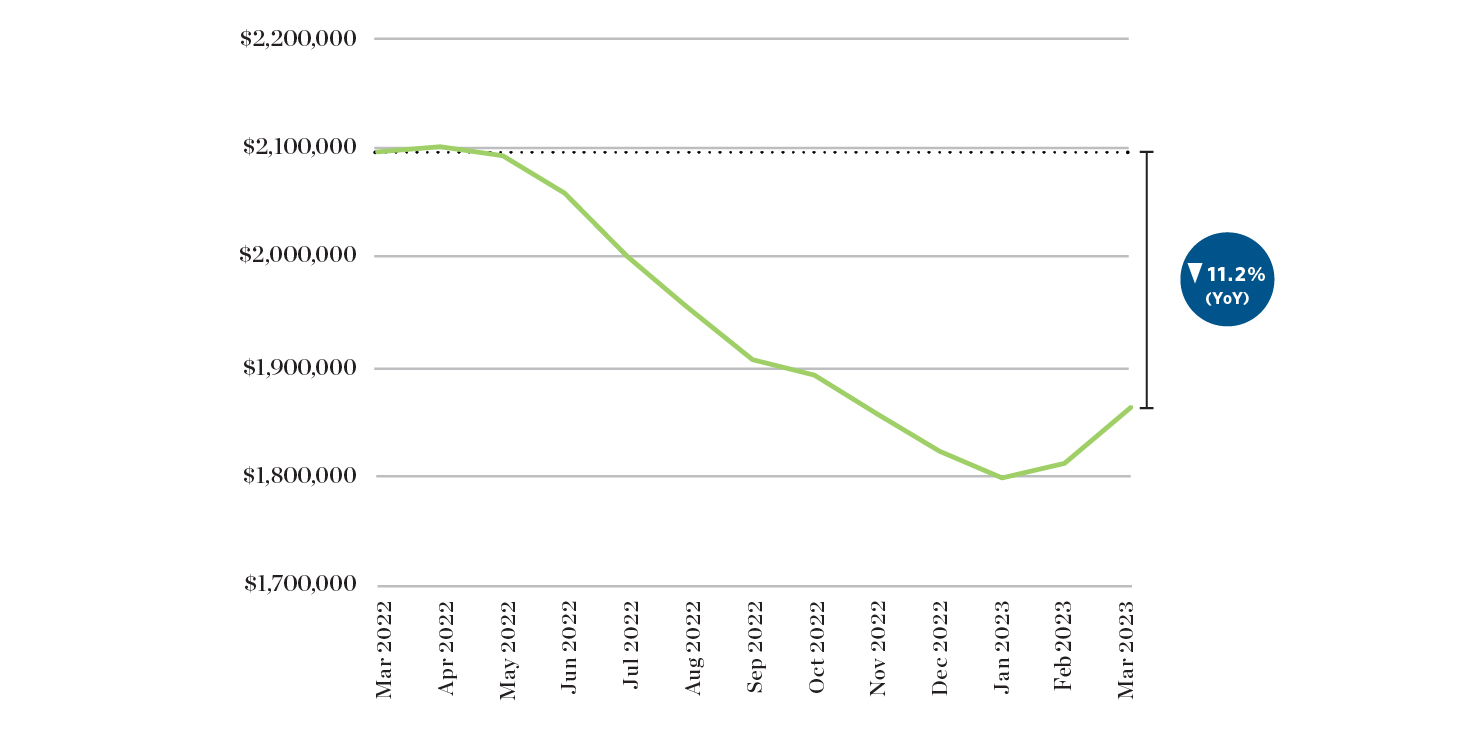
HPI Benchmark Price of Detached Homes
The benchmark price for detached homes exhibited a slight increase on a month-over-month basis, offering some respite from the prevailing trend. However, it is worth noting that this increase is still 11% lower than the benchmark price for the same period last year.
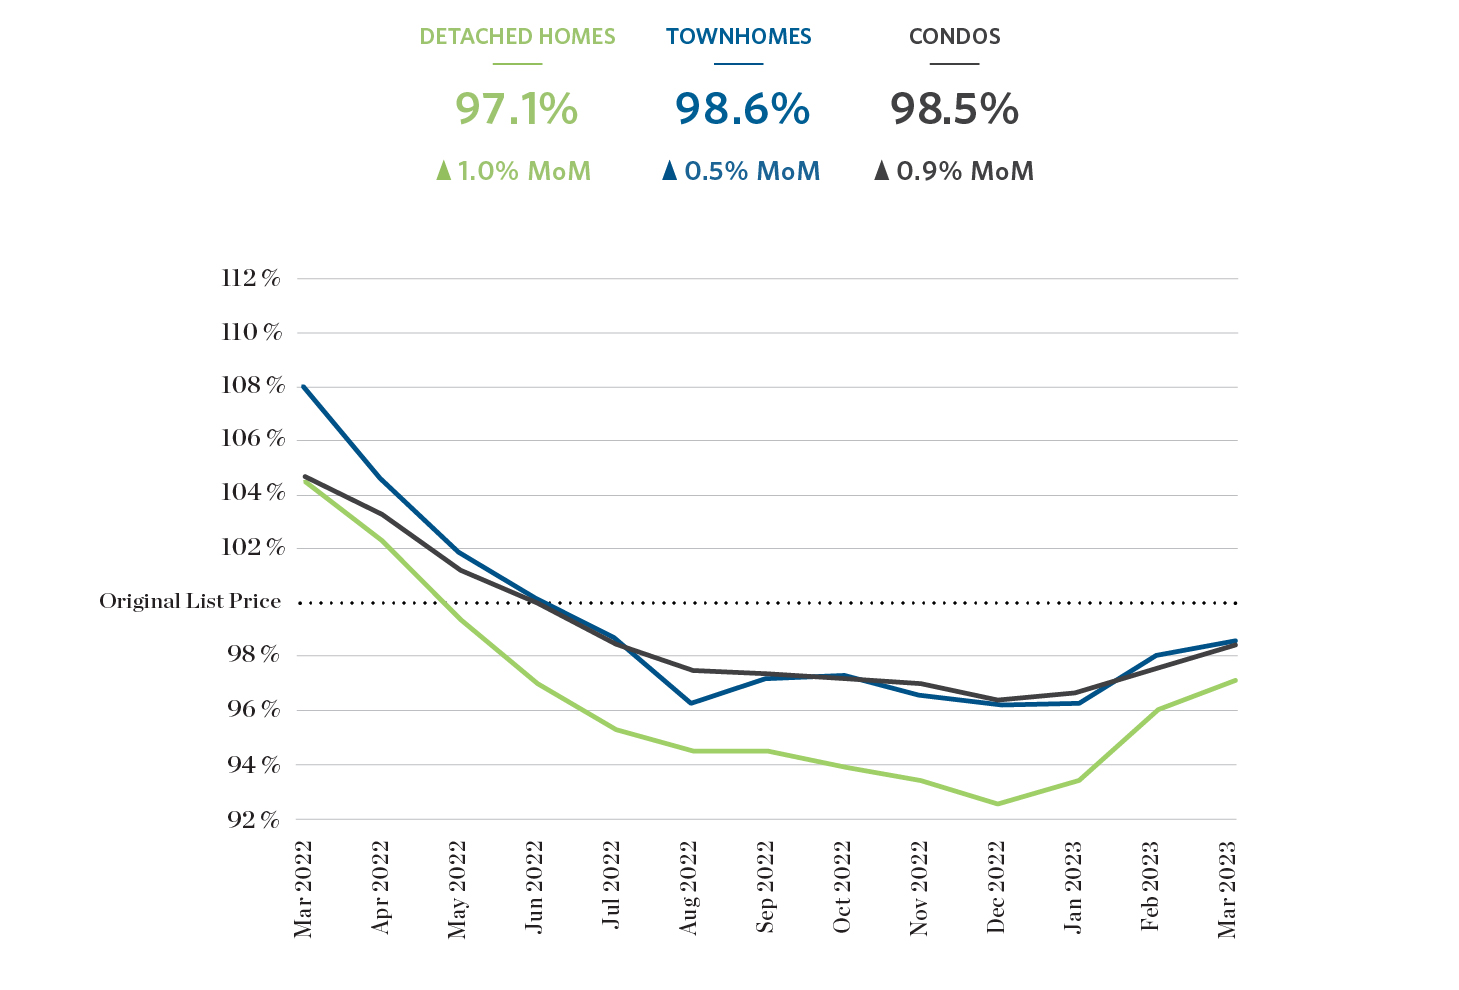
Sale Price As a Percent of Original List Price
The average percentage of the original sale price is currently exhibiting a gradual but consistent upward trend. While the increase may be modest, it is nevertheless a reassuring indication of progress.
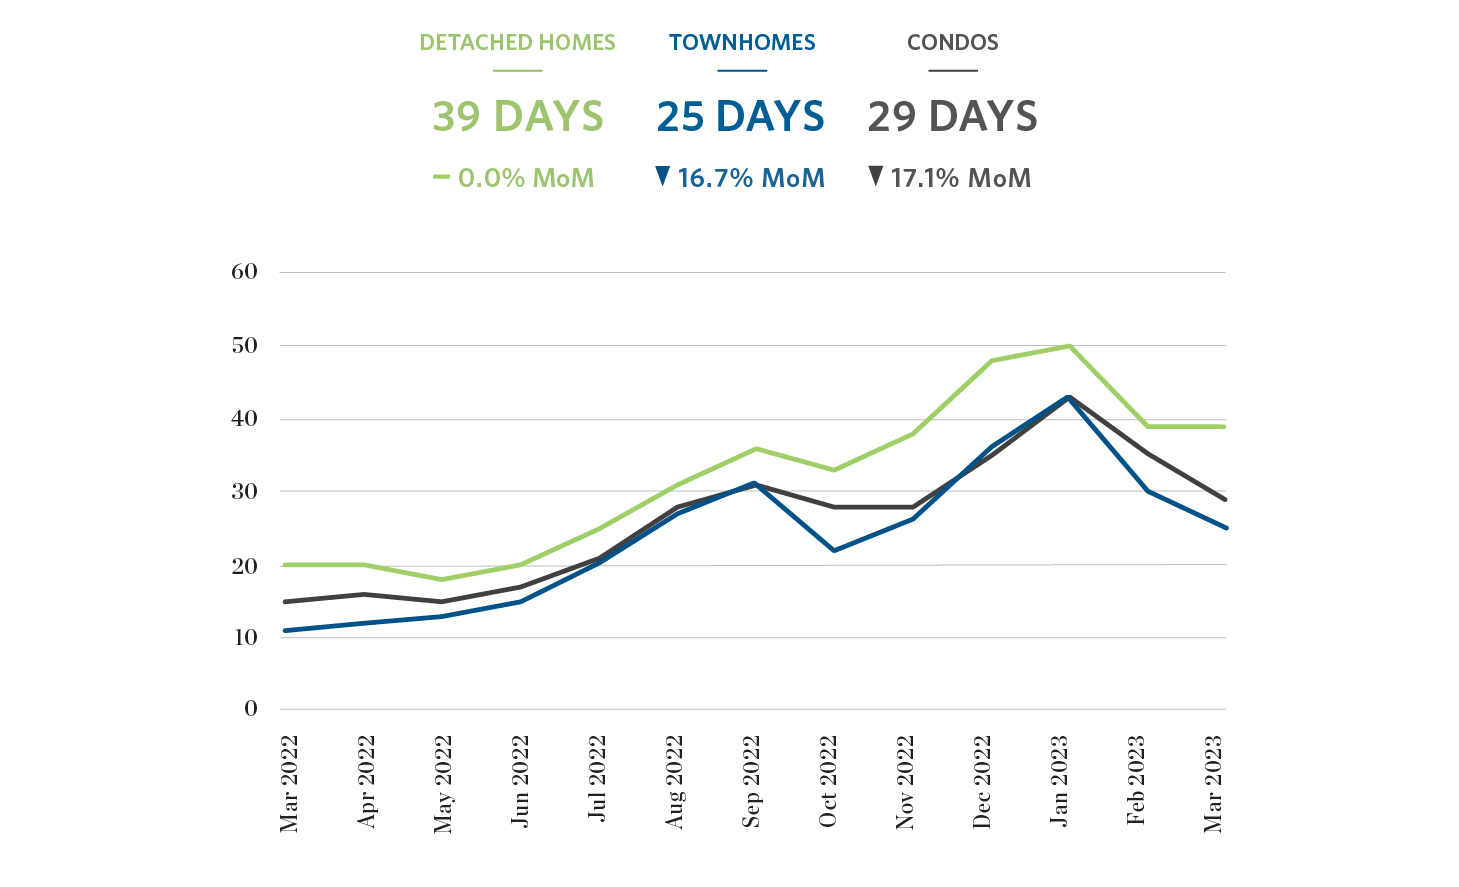
Days on Market
Average days on market for detached homes remained stable, while townhouses and condos saw a notable decrease of 16.7% and 17.1% respectively. This indicates an increase in demand for townhouses and condos.
Featured Homes
Looking for a new home? Check out these featured new homes courtesy of our affiliate company, Breakside Real Estate Group.


GREATER VANCOUVER RESIDENTIAL REAL ESTATE: MARCH 2023 statistics in infographics
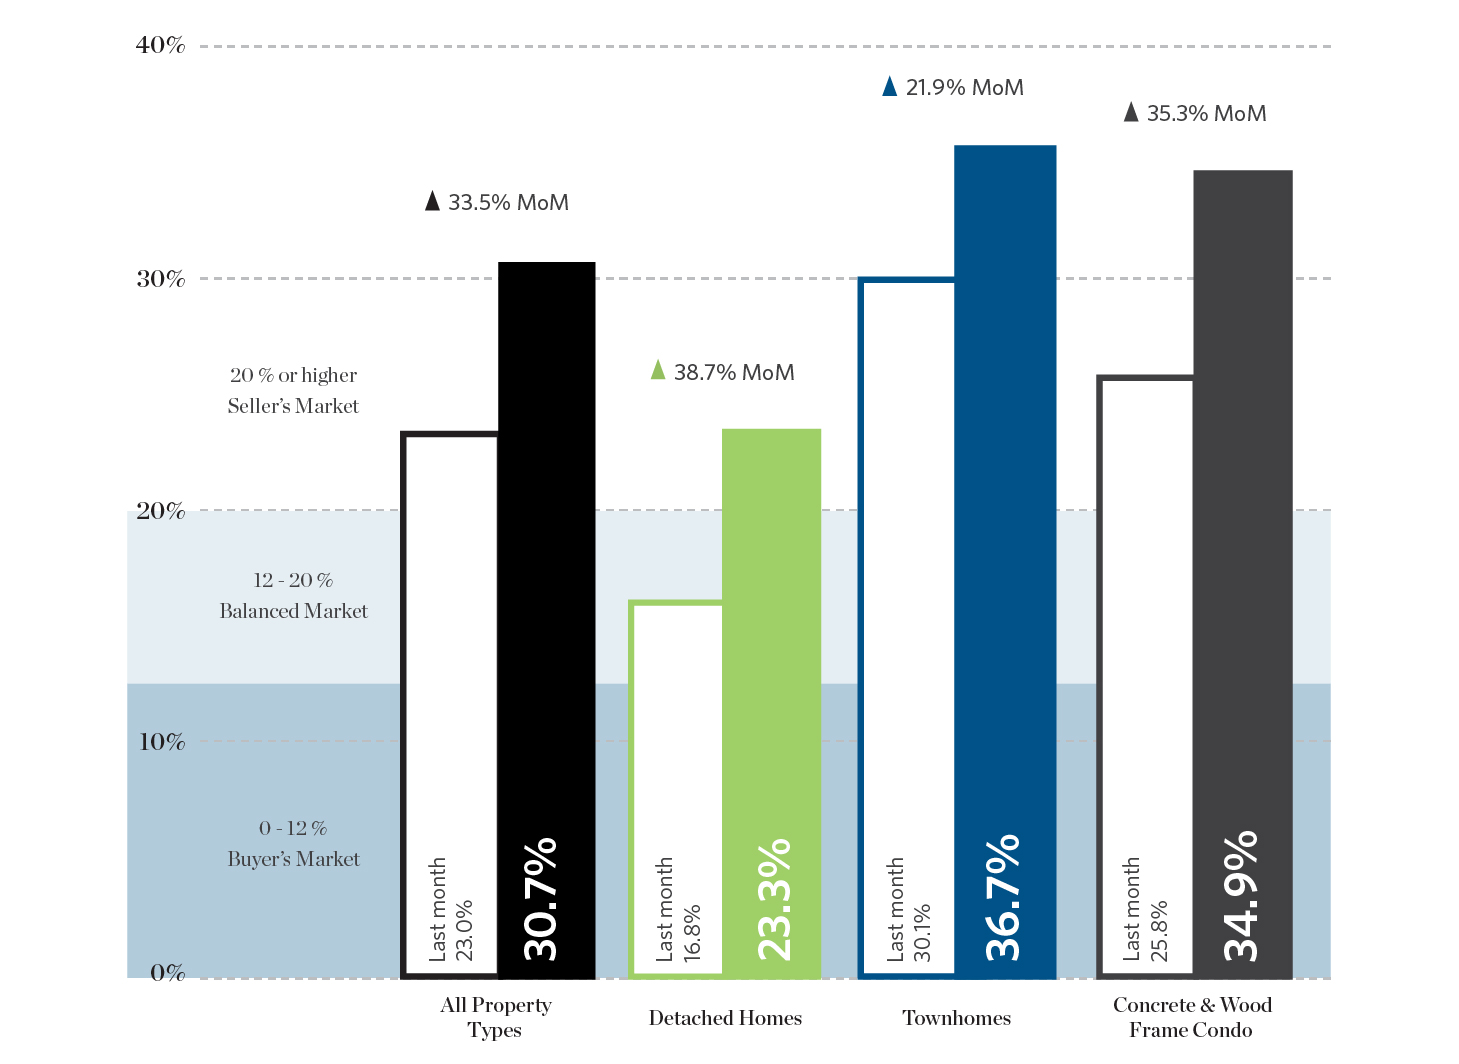
Sales To Active Listings Ratio
The sales to active ratio for all property types, including detached homes, townhouses, and condos, increased significantly from February to March, signaling a shift towards a seller’s market. This trend indicates potential opportunities for sellers to take advantage of the current market conditions.
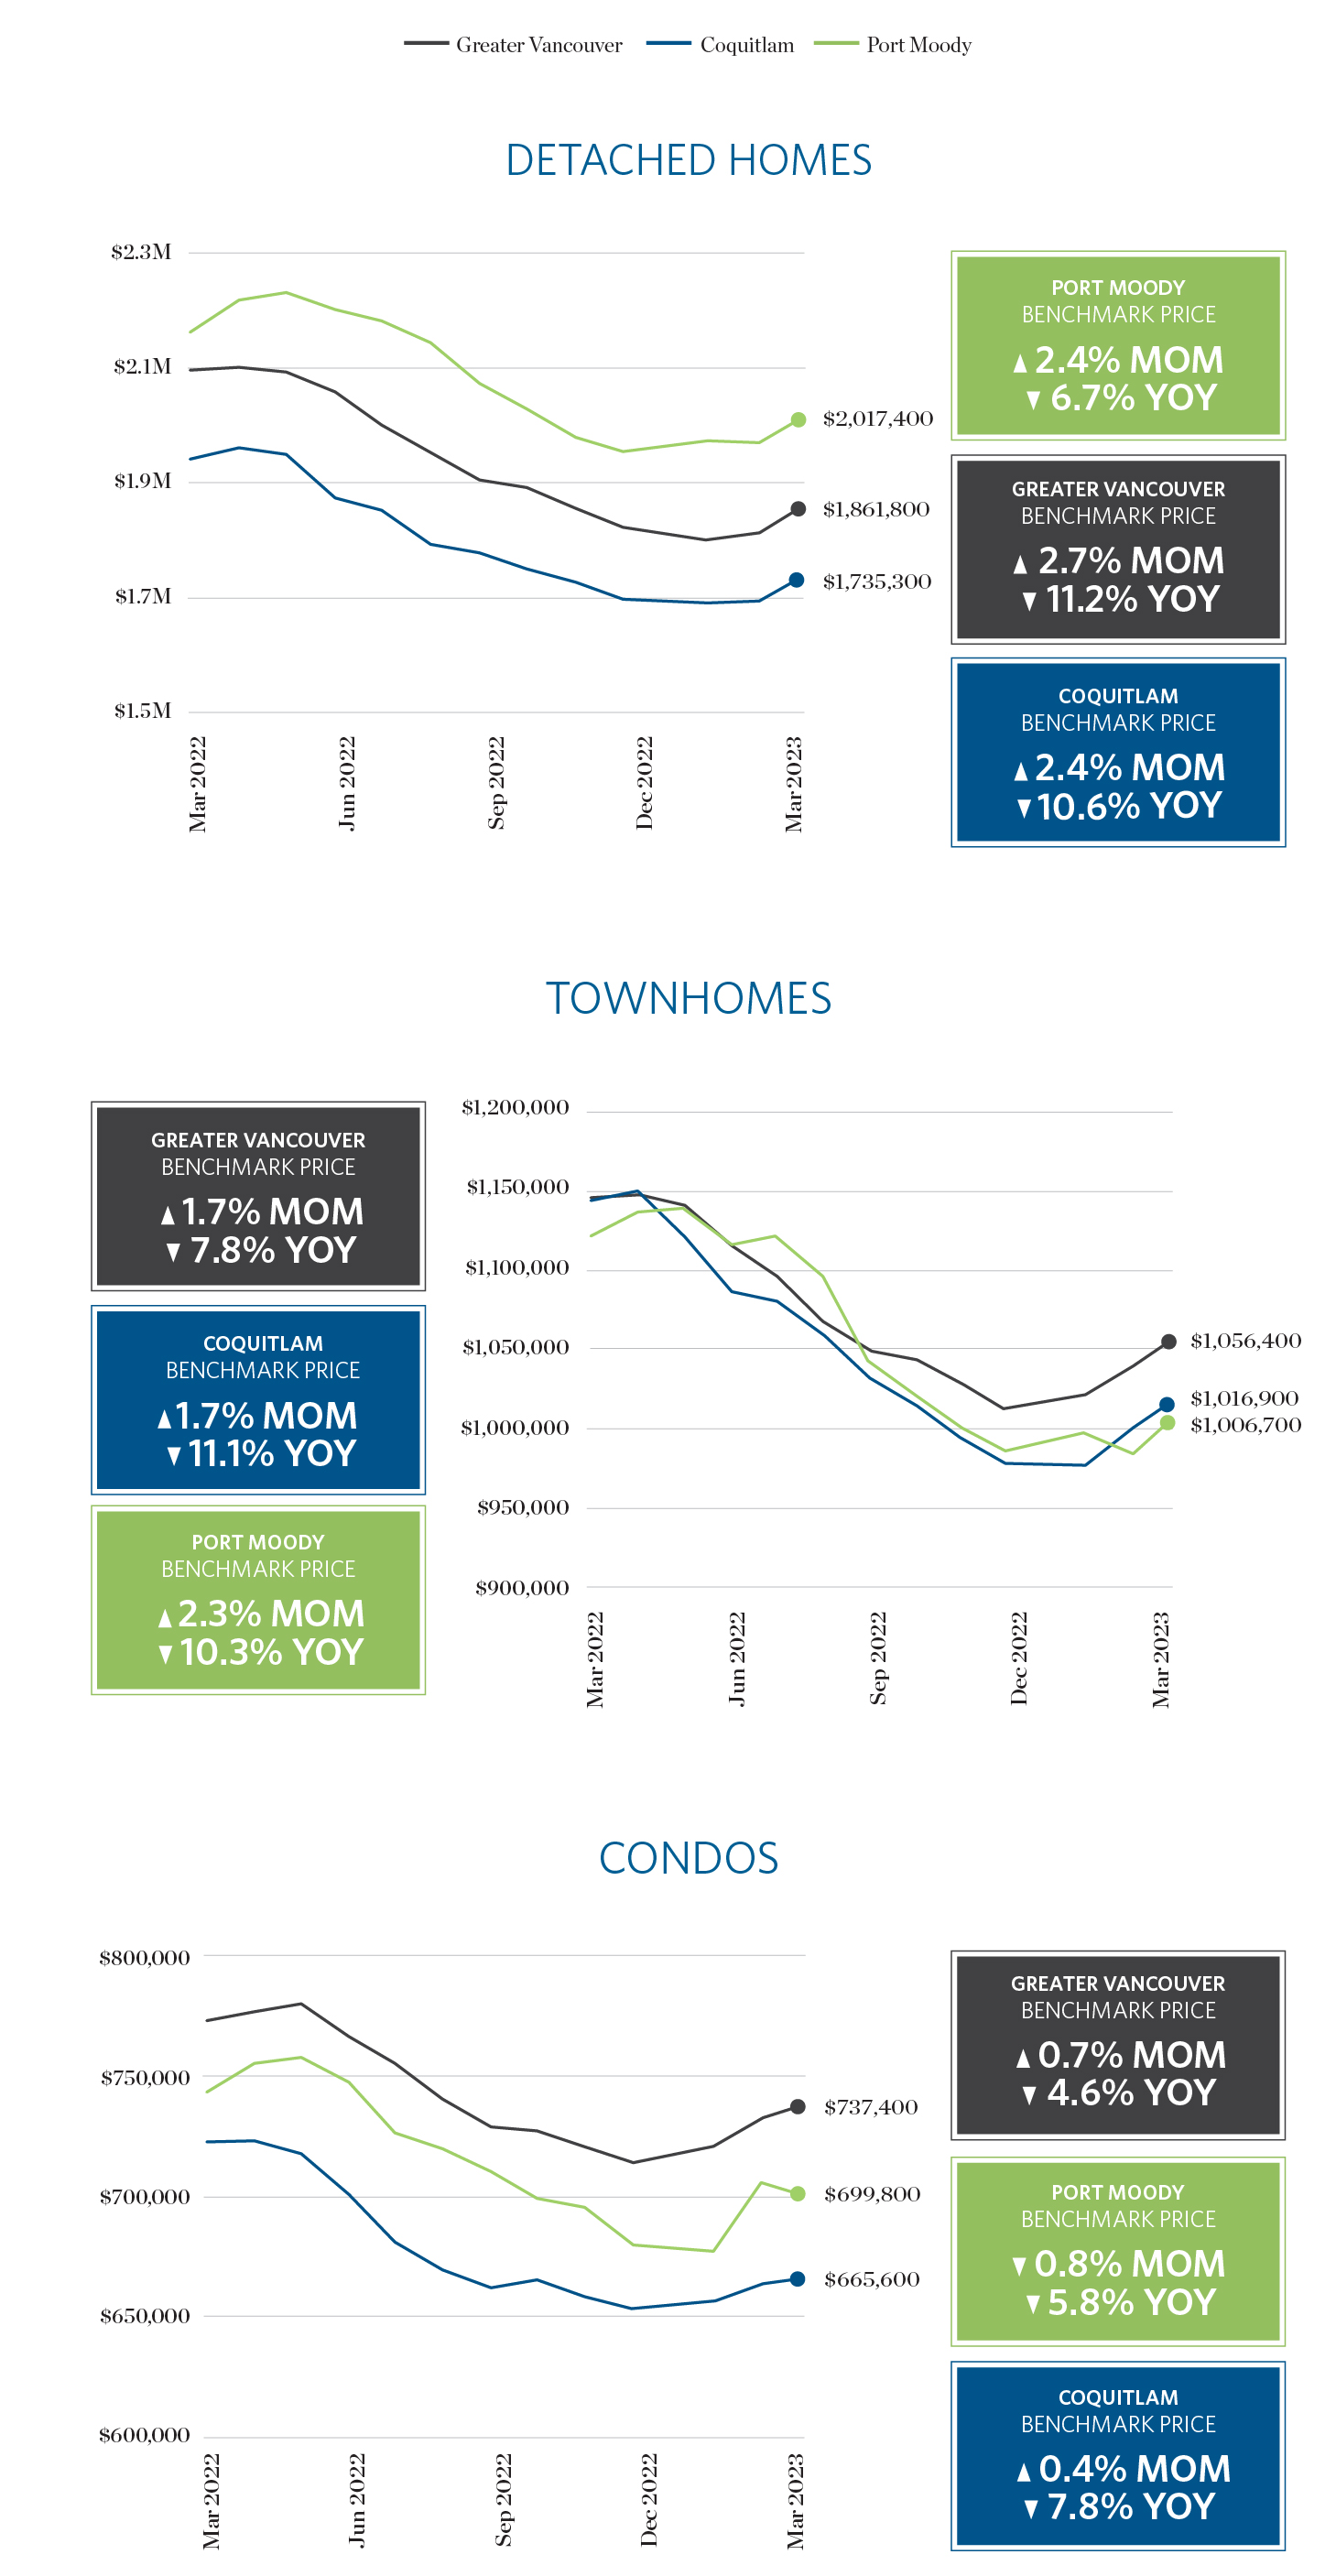
HPI Benchmark Prices
The Home Price Index (HPI) measures the price of a benchmark, or typical, property in a given market and is not influenced by the change in composition of properties sold, which can fluctuate quite significantly from month to month. As a result, this metric is a more pure and stable representation of market price change than average or median prices.
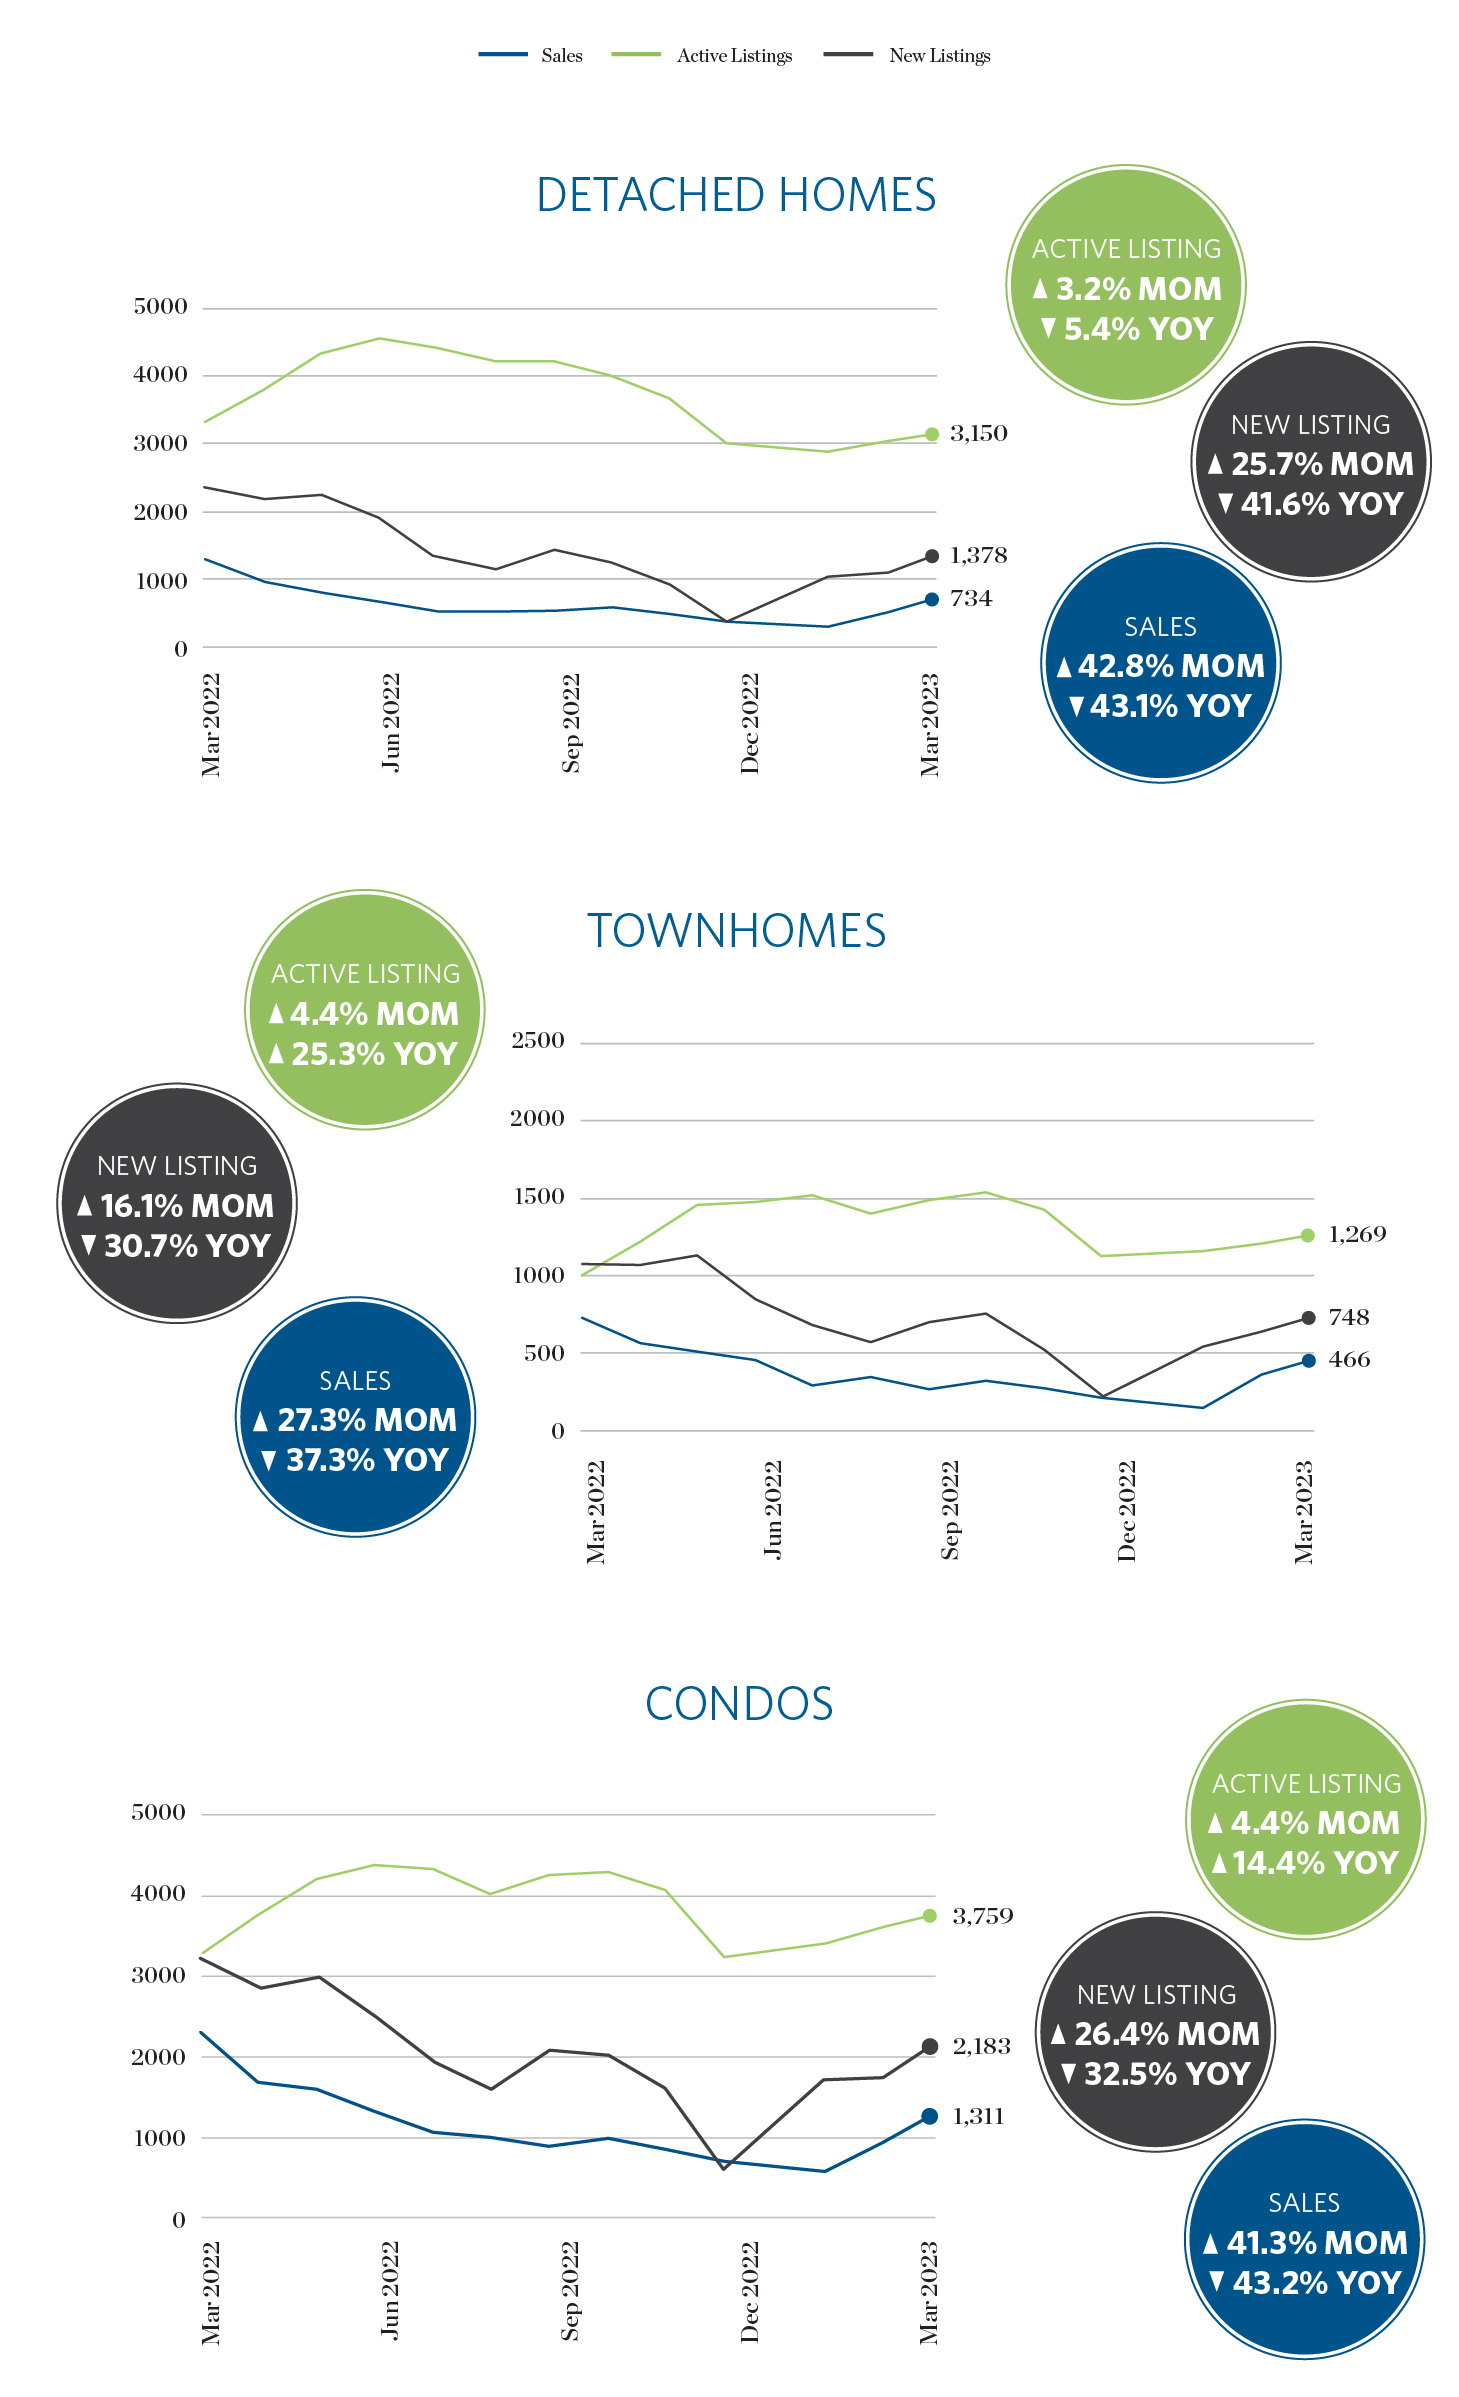
Sales • New Listings • Active Listings
An upward trend in month-over-month sales has been observed across all property types, with detached homes and condos experiencing an average increase of 40%, and townhomes at 27%. However, it is worth noting that these gains are still lower than those observed during the same period in the previous year.
Further Reading
View the Real Estate Board of Vancouver’s entire stats package for March 2023 here.
Sources
Sources: Breakside Real Estate Group, Real Estate Board of Greater Vancouver
This representation is based in whole or in part on data generated by the Real Estate Board of Greater Vancouver which assumes no responsibility for its accuracy.
