North of the Fraser Residential Real Estate: February 2020 Infographic
The February housing market statistics are in from the Real Estate Board of Greater Vancouver and they indicate a tepid kick off to the Spring market as far as sales volumes go, although there were far more sales recorded than this time last year.
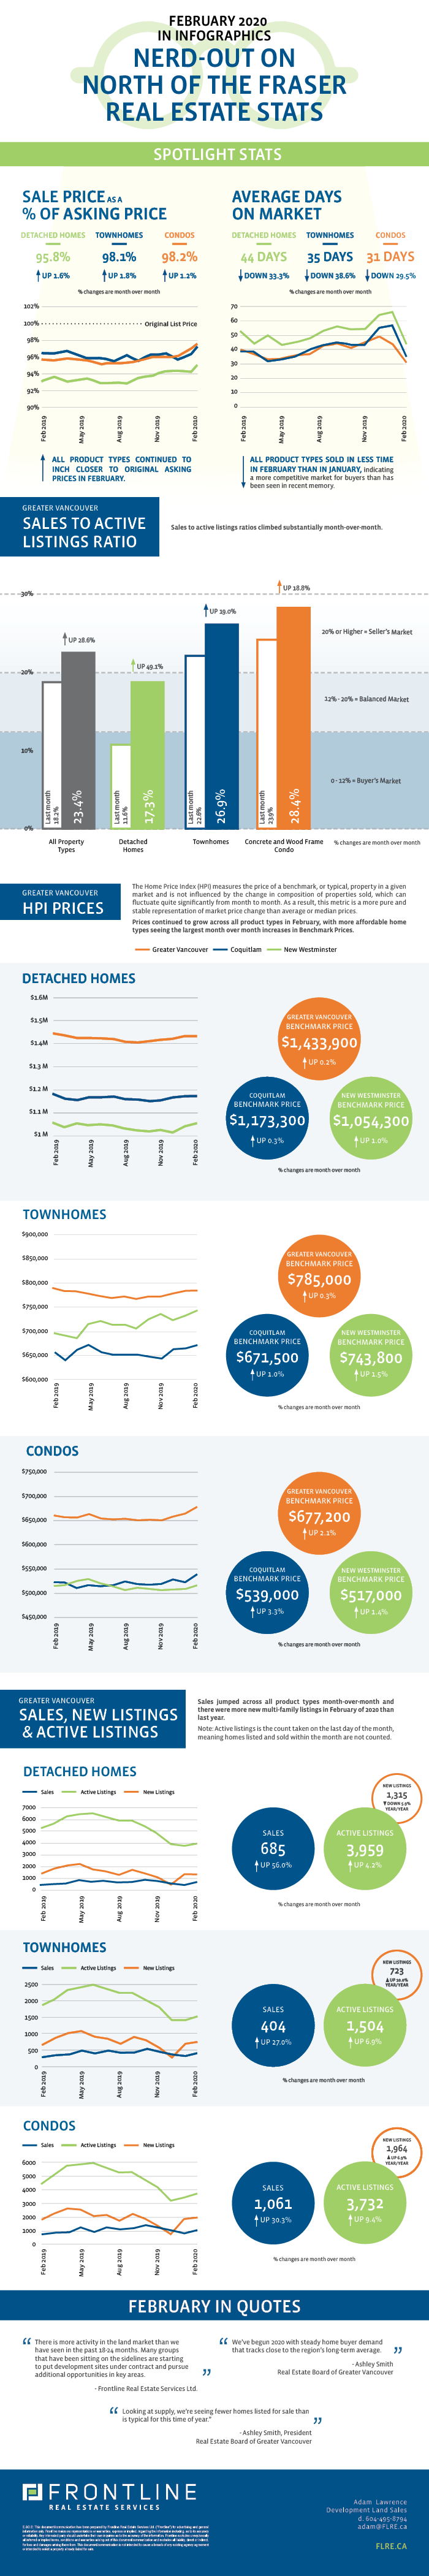
Sales for the month totalled 2,150 units, a 44.9% increase over February 2019 and a 36.9% increase month-over-month. The total inventory of active listings on the MLS grew to 9,195 units at the end of the month which was a 6.7% increase over January.
The modest increase in active listings gave prospective buyers more options when making a home buying decision last month, but overall didn’t provide any pricing relief. Index prices for all product types grew month-over-month. Detached homes and townhomes experienced modest price increases of 0.2% and 0.3% respectively while apartments jumped 2.1%.
The sales to active listings ratio for all product types is now at 23.4% which indicates a continued trend towards a seller’s market. Given the index price growth as well as the jump in sales to actives ratios for attached homes, it seems as though the market for more affordable homes, like townhouses and condos, is becoming quite competitive.
So What Does This Mean For The Development Land Market North Of The Fraser?
In the last 30 days, we have seen more developer activity in our core markets north of the Fraser River than what we saw over the last 18 months. Well located wood frame, townhouse and condo sites- especially those close to rapid transit- are once again being coveted by developers and there is now more competition for these sites than in recent memory.
Land prices are down considerably from the peak experienced in 2016-2017, and most deals will have favourable terms for the buyer, however increased demand from small to medium sized developers should drive both pricing and compressed deal timeline so long as market conditions remain stable and banks commit to financing these groups.
Sellers of properties with development potential can expect increased buyer attention on their sites, with competitive multiple offer situations a possibility for well located, well priced opportunities. Meanwhile. buyers of development land who have not seen much in the way of competition over the last 18-24 months can expect a return to a more typical, more competitive market. They should be prepared to act with a sense of urgency on quality opportunities, especially those within walking distance to rapid transit.
Check out our curated summary of the Real Estate Board of Greater Vancouver’s February stats in infographics below.
Please note: areas covered by the Real Estate Board of Greater Vancouver include: Whistler, Sunshine Coast, Squamish, West Vancouver, North Vancouver, Vancouver, Burnaby, New Westminster, Richmond, Port Moody, Port Coquitlam, Coquitlam, Pitt Meadows, Maple Ridge, and South Delta.
View the Real Estate Board of Greater Vancouver’s entire stats package for February 2020 here.
This representation is based in whole or in part on data generated by the Real Estate Board of Greater Vancouver which assumes no responsibility for its accuracy.
