North of the Fraser Residential Real Estate: February 2022 Infographic
The Real Estate Board of Greater Vancouver (REBGV) housing market statistics are out for February and the data shows that the market is continuing to intensify, despite the increase in listings.
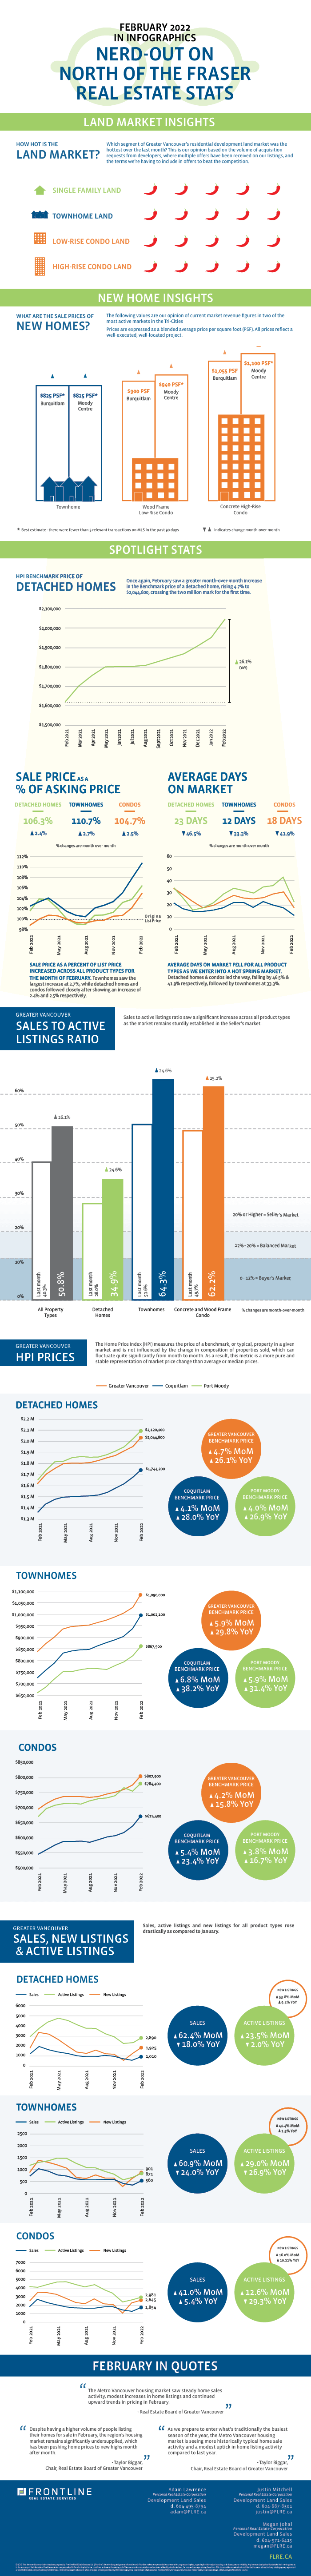
In the month of February, we saw sales volume pick up across all product types after the winter lull; detached homes and townhomes led the way with a 62.4% and 60.9% month-over-month increase respectively, followed by condos at a 41% increase. Although this increase seems rather drastic when compared to January, it’s important to note that, when combined, all product types had a year-over-year decrease. Despite that, the trajectory of sales is moving in the anticipated upward direction as we enter the spring market frenzy.
The surge of listings in February has been the hot topic this month across Metro Vancouver. Listings saw a month-over-month increase between 16% and 53.8% depending on product type (see infographic below of more details); combined for all product types, this equated to a 31.2% increase compared to January of this year, and a 8.4% increase when compared to February of last year.
What was more notable to us, however, was the radical decrease in days on market for all product types. Detached homes and condos decreased month-over-month by 46.5% and 41.9% respectively, while townhomes experienced a slightly less dramatic drop of 33.3% in the average time spent listed. Moreover, sale price as a percent of list price and benchmark pricing continued to increase across all home types in the primary markets we focus on. In last months report we mentioned a decrease in the benchmark price for apartments in Port Moody and, as expected, the drop was in fact an anomaly as the price has since risen 3.8% over last month. Further, benchmark pricing for detached homes broke through the $2 million mark for the first time, and that increase is expected to continue to climb as we head into a hot spring market.
What does this mean for the development land market?
As mentioned, the talk of the town has been the surge of listings across all product types, however this wave of listing activity is not the golden solution to the supply issues; these sellers will likely also be buyer’s in the market as they look at relocating to another home. The solution for the supply dilemma will come from a concentrated effort to tackle the consistent lack of new inventory, and push forward the back log of applications for new developments.
In an effort to not sound too much like a broken record, we’ll say this: developers remain keen to keep their pipeline of development sites quite active. The demand for homes remains solid and, until more product is delivered, the upward pressure on pricing is expected to continue.
Check out our curated summary of the Greater Vancouver Real Estate Board’s February Stats in our infographic below.
Please note: areas covered by the Real Estate Board of Greater Vancouver include: Whistler, Sunshine Coast, Squamish, West Vancouver, North Vancouver, Vancouver, Burnaby, New Westminster, Richmond, Port Moody, Port Coquitlam, Coquitlam, Pitt Meadows, Maple Ridge, and South Delta.
View the Real Estate Board of Greater Vancouver’s entire stats package for February 2022 here.
This representation is based in whole or in part on data generated by the Real Estate Board of Greater Vancouver which assumes no responsibility for its accuracy.
