North of the Fraser Residential Real Estate: January 2020 Infographic
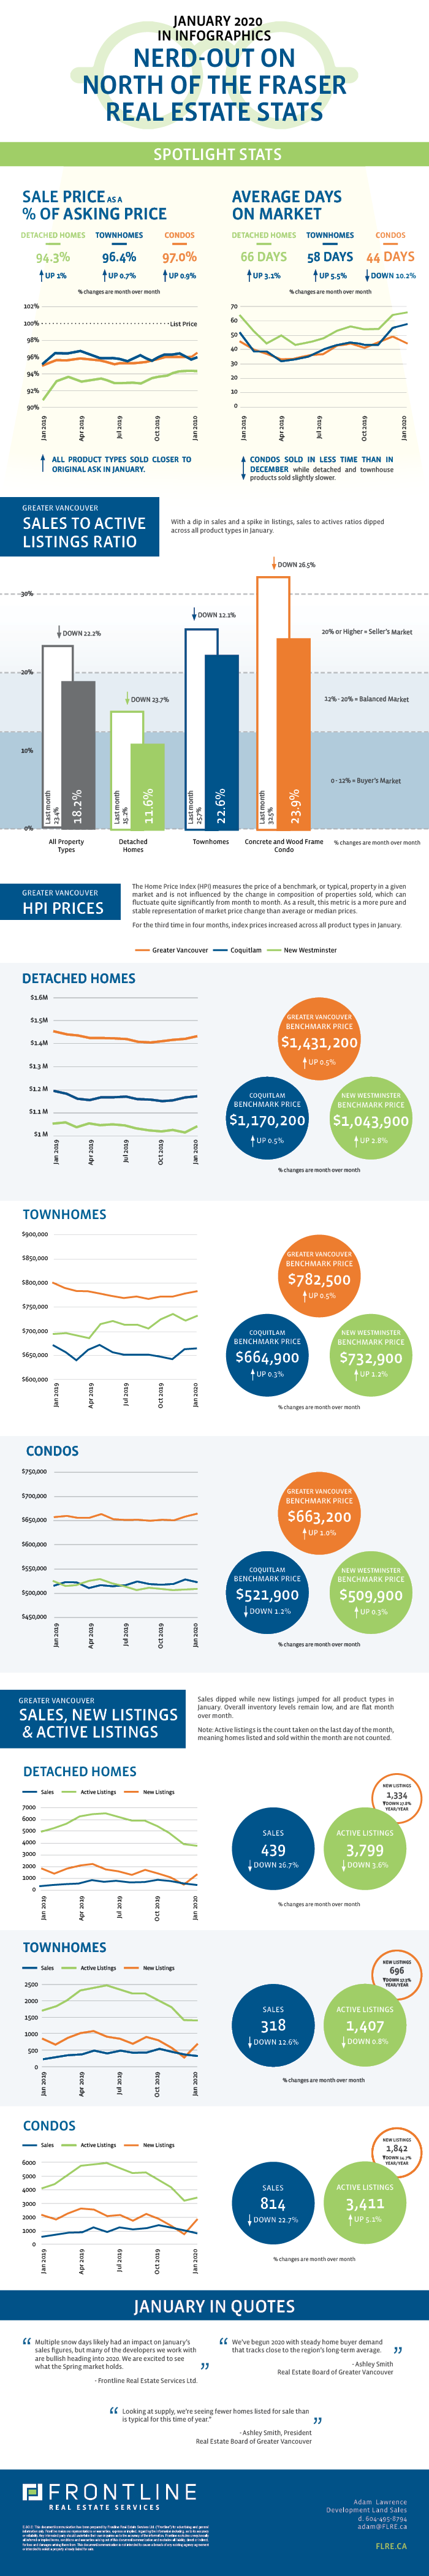
The January MLS housing market statistics are in from the Real Estate Board of Greater Vancouver and while sales activity was down month-over-month, constrained supply and moderate buyer activity once again caused index price growth across all product types. January was the third time in the last four months that prices increased for all three residential product types across Greater Vancouver.
There were 3,872 properties newly listed across all product types in January, which was a substantial jump over December 2019 when only 1588 homes were listed. However, January 2020 saw 976 fewer homes come to market relative to January 2019, a decrease of approximate 20.1%. General home supply remains constrained, with a total of 3,799 detached homes, 1,407 townhouses and 3,411 condos available at month’s end.
Sales to active listings ratios did drop month over month due to the decrease in sales and boost in new listings, but the ratio remains in sellers market territory for both townhomes and condos. The detached home market did fall below the 12% threshold, moving into a sellers market for the first time since June 2019, but it is worth mentioning that January 2020’s figure was substantially above the 6.8% reported in January 2019.
So What Does This Mean For The Development Land Market North Of The Fraser?
In our core markets North of the Fraser there is a prevailing sentiment of optimism amongst the development community and the development land market is picking up. While optimism has returned, it appears as though the speculative demand that was once the key upward driver of land prices is largely absent. Developers are once again beginning to write offers and put sites under contract, however pricing and deal terms remain more favourable to buyers than at the peak of the market.
There is a lot of excitement heading into 2020, especially in Coquitlam as several long awaited land use plans in both Oakdale and City Centre make considerable progress and near adoption. Some good development opportunities remain in these areas, however the substantial inventory that was available early in 2019 is starting to dwindle. Generally, it seems that once again there are more buyers than sellers in the market and as market conditions continue to shift, it may be just a matter of time before land prices begin to rise again.
Check out our curated summary of the Real Estate Board of Greater Vancouver’s December stats in infographics below.
Please note: areas covered by the Real Estate Board of Greater Vancouver include: Whistler, Sunshine Coast, Squamish, West Vancouver, North Vancouver, Vancouver, Burnaby, New Westminster, Richmond, Port Moody, Port Coquitlam, Coquitlam, Pitt Meadows, Maple Ridge, and South Delta.
View the Real Estate Board of Greater Vancouver’s entire stats package for January 2020 here.
This representation is based in whole or in part on data generated by the Real Estate Board of Greater Vancouver which assumes no responsibility for its accuracy.
