North of the Fraser Residential Real Estate: January 2022 Infographic
The Real Estate Board of Greater Vancouver has released the first set of housing market statistics for this year and the supply issue that we witnessed in 2021 continues. The listing inventory on MLS is less than 50% of what is considered ideal for this time of year, and as a result, the competition remains acute for the limited number of homes for sale. What is that a recipe for? You guessed it, higher prices.
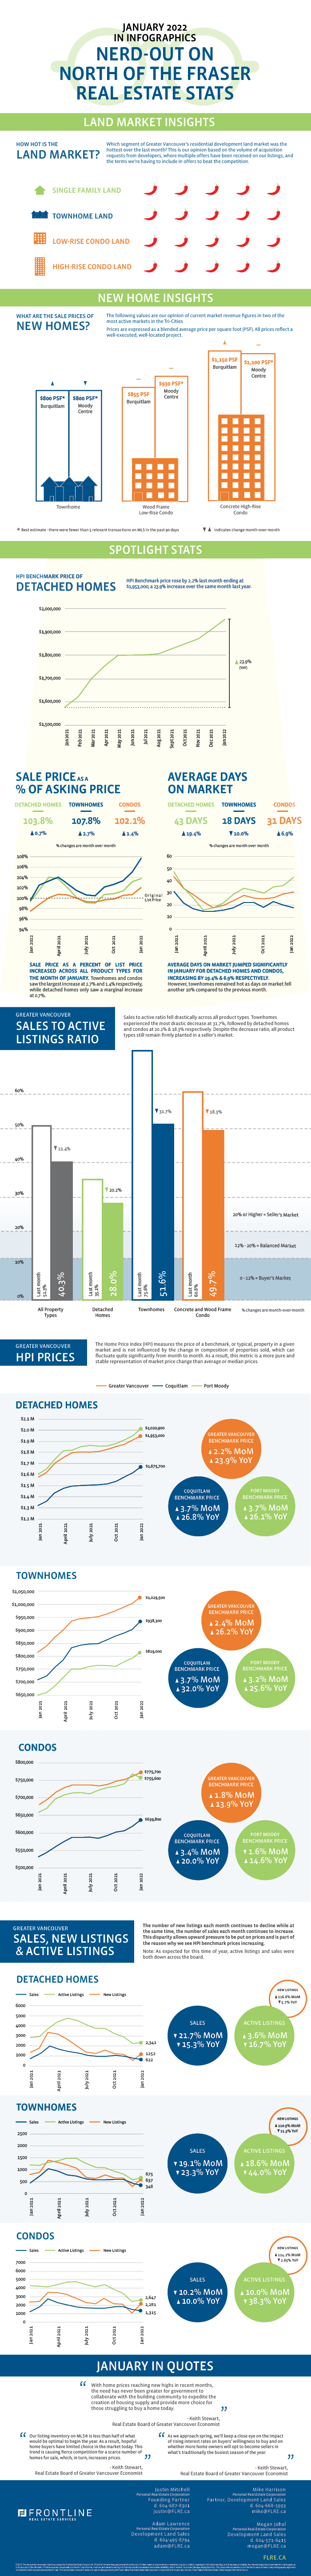
In the month of January, we saw sales volume decrease for all product types; when compared to the previous month. Detached homes and townhomes fell by 21.7% and 19.1% respectively, followed by condos at a 10.2% decrease. Although this month-over-month decrease in sales is not atypical for this time of year, the overall sales volume in January remains 25.3% above the 10-year average for the month. The same can be said for active listings, which remain between 16.7% (detached homes) and 44% (townhomes) below the same month last year, despite a small uptick in listings when compared to the prior month. Our infographic below goes into more depth on these numbers.
The days on market for detached homes and condos increased month-over-month by 19.4% and 6.9% respectively, whereas townhomes experienced a 10% decrease in the average time spent listed. The sale price as a percent of list price increased for all product types, albeit marginally, rising by 2.7%, 1.4% and 0.7% for townhomes, condos, and detached homes. Benchmark pricing increased for all product types across all the key markets we examine, except for apartments in Port Moody, which fell by 1.6% when compared to December 2021. This benchmark price decrease for Port Moody is likely a blip and not expected to continue.
What does this mean for the development land market?
With house prices hitting record highs over the last few months, the need has never been higher for the government to work with builders, developers and municipalities to speed up the production of new housing supply and provide more options for individuals who are currently unable to purchase a home.
Because of these housing market trends and challenges, demand for land remains high from developers across all home types. Even sites that were considered “not as hot” in previous months are gaining traction, which keeps upward pressure on land values. There are sites that may not have made sense in a proforma 3-6 months ago, but with the revenue numbers increasing at the current rate, these sites are now being revisited and considered as hot opportunities.
Check out our curated summary of the Greater Vancouver Real Estate Board’s January Stats in our infographic below.
Please note: areas covered by the Real Estate Board of Greater Vancouver include: Whistler, Sunshine Coast, Squamish, West Vancouver, North Vancouver, Vancouver, Burnaby, New Westminster, Richmond, Port Moody, Port Coquitlam, Coquitlam, Pitt Meadows, Maple Ridge, and South Delta.
View the Real Estate Board of Greater Vancouver’s entire stats package for January 2022 here.
This representation is based in whole or in part on data generated by the Real Estate Board of Greater Vancouver which assumes no responsibility for its accuracy.
