North of the Fraser Residential Real Estate: June 2019 Infographic
The June housing market stats are in from the Real Estate Board of Greater Vancouver and they indicate continued soft market conditions after a minor uptick in sales activity in May.
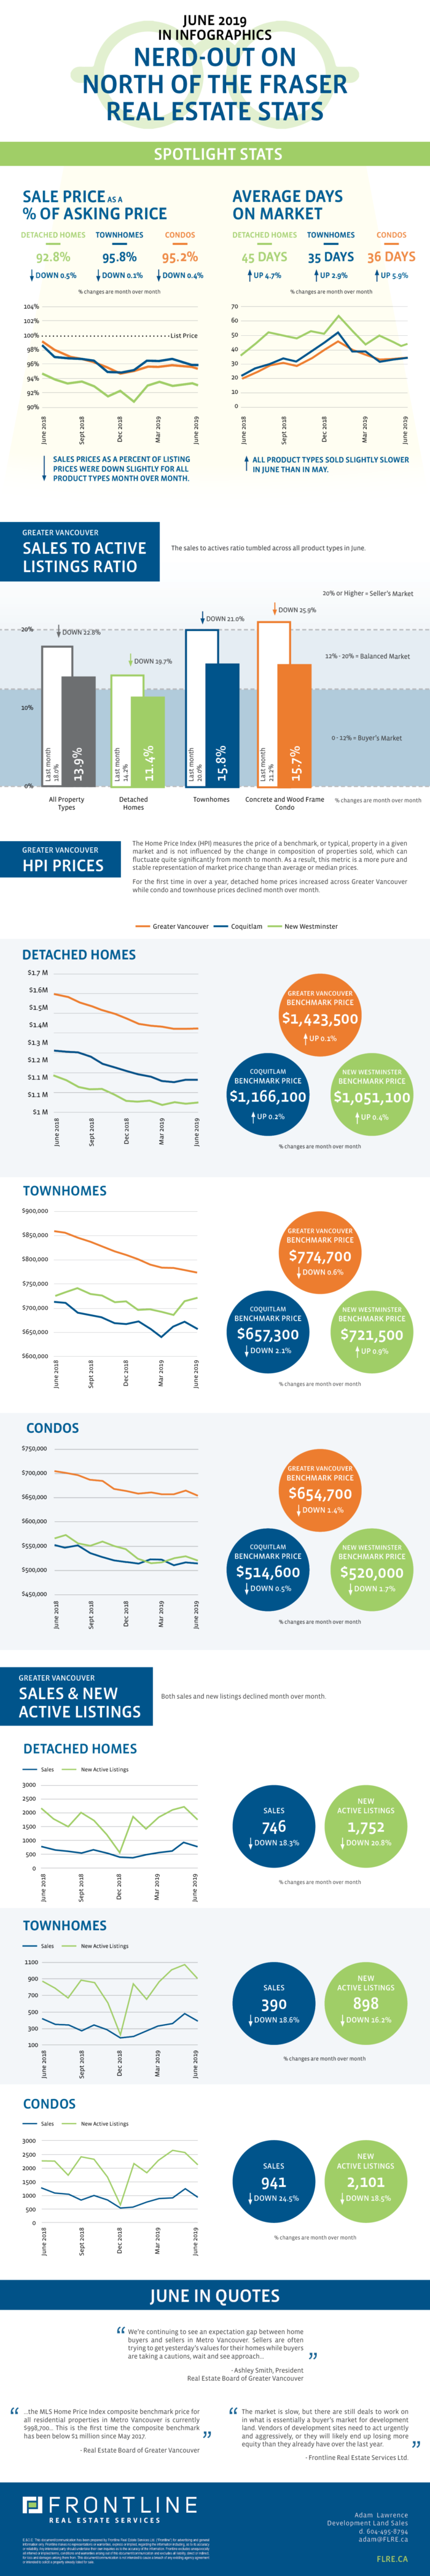
Sales for the month were 34.7% below the 10-year average making June 2019’s sales performance the weakest for the month since 2000. Sales totalled 2,077 units across all product types in June, which was a 14.4% decline from the same month last year and a 21.3% decline from May 2019. From a sales volume perspective, the Spring market was one of the weakest on record since the 1990’s.
Inventories across all product types continue to accumulate as a result of slow sales, however, we have not seen a rush of new listings hitting the market each month. As a matter of fact, the 4,751 new listings in June were approximately 10% less than new listings posted to the MLS in June 2018 and 18.9% less than May 2019, when 5,861 properties hit the market across Greater Vancouver. Across the board, inventory was only about 1.9% higher than the 10-year average for the month of June.
Across Greater Vancouver the housing price index declined for both townhouses and condos, by 0.6% and 1.4% respectively. Perhaps the lone bright spot in a gloomy month of stats was that detached homes showed a modest 0.1% increase month-over-month, ending a streak of twelve consecutive months of price declines.
What does this mean for development land north of the Fraser?
While the market is slow, there are still development land deals being put together in our core markets North of the Fraser, albeit at prices that are considerably lower than the peak prices observed over the last two years. Buyers of development land are under no pressure to make rushed decisions when it comes to an acquisition and, as such, are expecting favourable due diligence and completion times in addition to lower prices. Owners of development land looking to sell a property in this market need to be mindful of these market conditions and should be prepared to offer more value than competing properties in order to facilitate a transaction.
Check out our curated summary of the Real Estate Board of Greater Vancouver’s June stats in infographics below.
Please note: areas covered by the Real Estate Board of Greater Vancouver include: Whistler, Sunshine Coast, Squamish, West Vancouver, North Vancouver, Vancouver, Burnaby, New Westminster, Richmond, Port Moody, Port Coquitlam, Coquitlam, Pitt Meadows, Maple Ridge, and South Delta.
View the Real Estate Board of Greater Vancouver’s entire stats package for June 2019 here.
This representation is based in whole or in part on data generated by the Real Estate Board of Greater Vancouver which assumes no responsibility for its accuracy.
