North of the Fraser Residential Real Estate: March 2021 Infographic
The March residential market stats are in and, as it’s been reported far and wide, the market is crazy.
Sales volumes hit an all time high in March, with the REBGV reporting an incredible 5,703 transactions for the month. This is more than double what was reported in March 2020 and over 53% more than for the number of sales in the previous month (February 2021). These sales volumes were fueled in large part by another record for the month, which is the number of new listings that hit the market in March 2021. Obviously, the increase in available inventory was a welcome gift for buyers as they opted to snap those properties up just as quickly as they hit the market. Correspondingly, prices continued to increase substantially for single family homes (+4.9% month over month, +17.9% year over year) and townhomes (+3.9% month over month, +10.4% year over year).
So What Does This Mean For The Development Land Market North Of The Fraser?
The increased momentum in the market has definitely pushed most developers off of the sidelines and into the development land market. Most groups that were waiting to see how deep the “Pandemic Market” actually is, are now finding that they simply cannot wait any longer before pursuing an acquisition. As such, we are now seeing an increase in demand for all types of development sites, whether they be high density condo or single family subdivisions. Prices for development land are starting to creep up as revenues in the presale market are showing strong growth and land owner expectations increase. The increases in land values remain modest for now as they are somewhat constrained by increased construction costs, but the supply of good sites is shrinking by the day and competition for land is increasing accordingly.
There remain some lingering questions about just how deep the current homebuyer market is as it is almost exclusively driven by local consumers, however the consensus among those active in the market is that we are probably only seeing the tip of the iceberg when it comes to price increases and supply shortages in the medium term. With more people vaccinated and more areas of the world opening up every day, it seems like just a matter of time before immigration picks up and starts to impact our market in a way that many of us have never seen before.
Check out our curated summary of the Real Estate Board of Greater Vancouver’s March stats in infographics below.
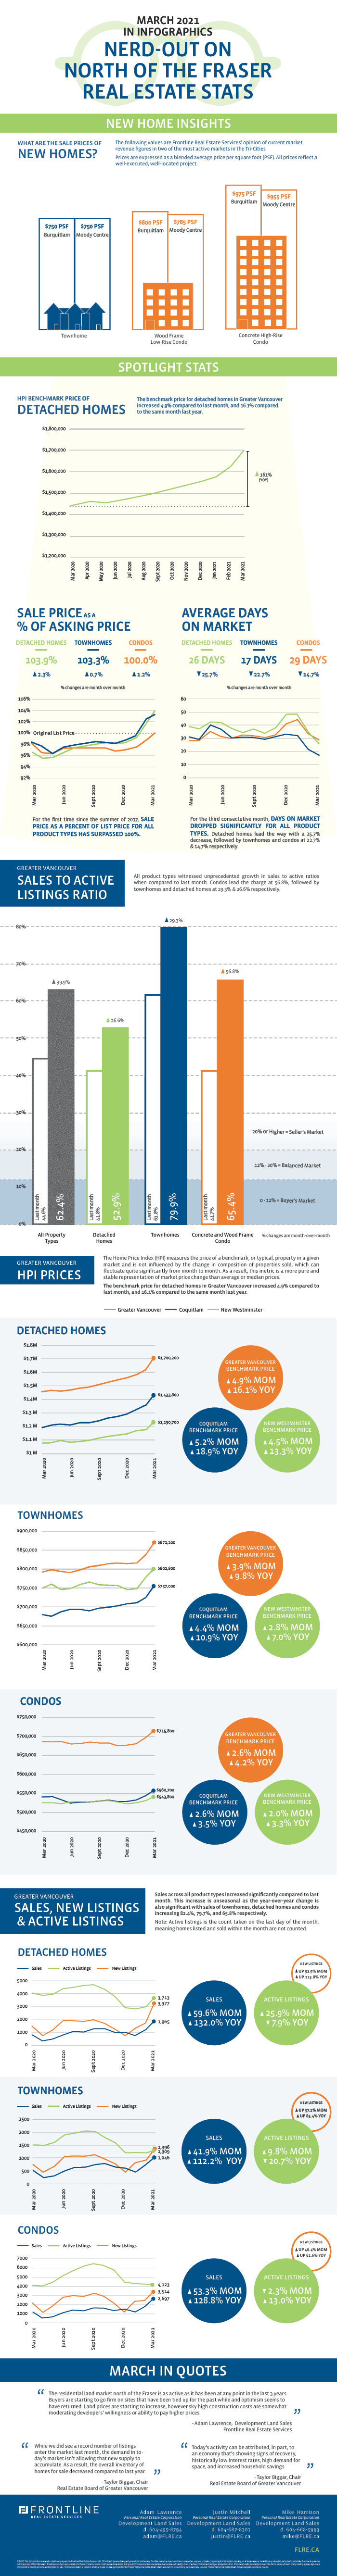
As you may have noticed, we have made some changes to the infographic and will now be reporting year-over-year changes of key metrics as well as new home revenues in select markets-. Please reach out if you have any feedback on these changes or if there are any other data points that would be helpful for us to bring to you every month.
Please note: areas covered by the Real Estate Board of Greater Vancouver include: Whistler, Sunshine Coast, Squamish, West Vancouver, North Vancouver, Vancouver, Burnaby, New Westminster, Richmond, Port Moody, Port Coquitlam, Coquitlam, Pitt Meadows, Maple Ridge, and South Delta.
View the Real Estate Board of Greater Vancouver’s entire stats package for March 2021 here.
This representation is based in whole or in part on data generated by the Real Estate Board of Greater Vancouver which assumes no responsibility for its accuracy.
