The Sky is Not Falling in the Fraser Valley
The Fraser Valley Residential Real Estate Market is Finding Equilibrium
Each month we analyze the Fraser Valley Real Estate Board’s stats to extract key insights and build our monthly infographic (shameless plug – email us at [email protected] to receive it). This month, in an effort to find some context for stats that look dramatic when viewed with a short-term lens and compared to recent record-breaking years, we zoomed out and looked at the last decade of market data and found that many of the key activity metrics and indicators of competition are returning to an equilibrium. Below, we’ve used townhome sales data to illustrate this as townhomes are a staple product type in the Fraser Valley, but it’s worth noting that we could have just as easily used detached homes or condos as they exhibit the same behaviour.
Inventory Levels are Back to Normal
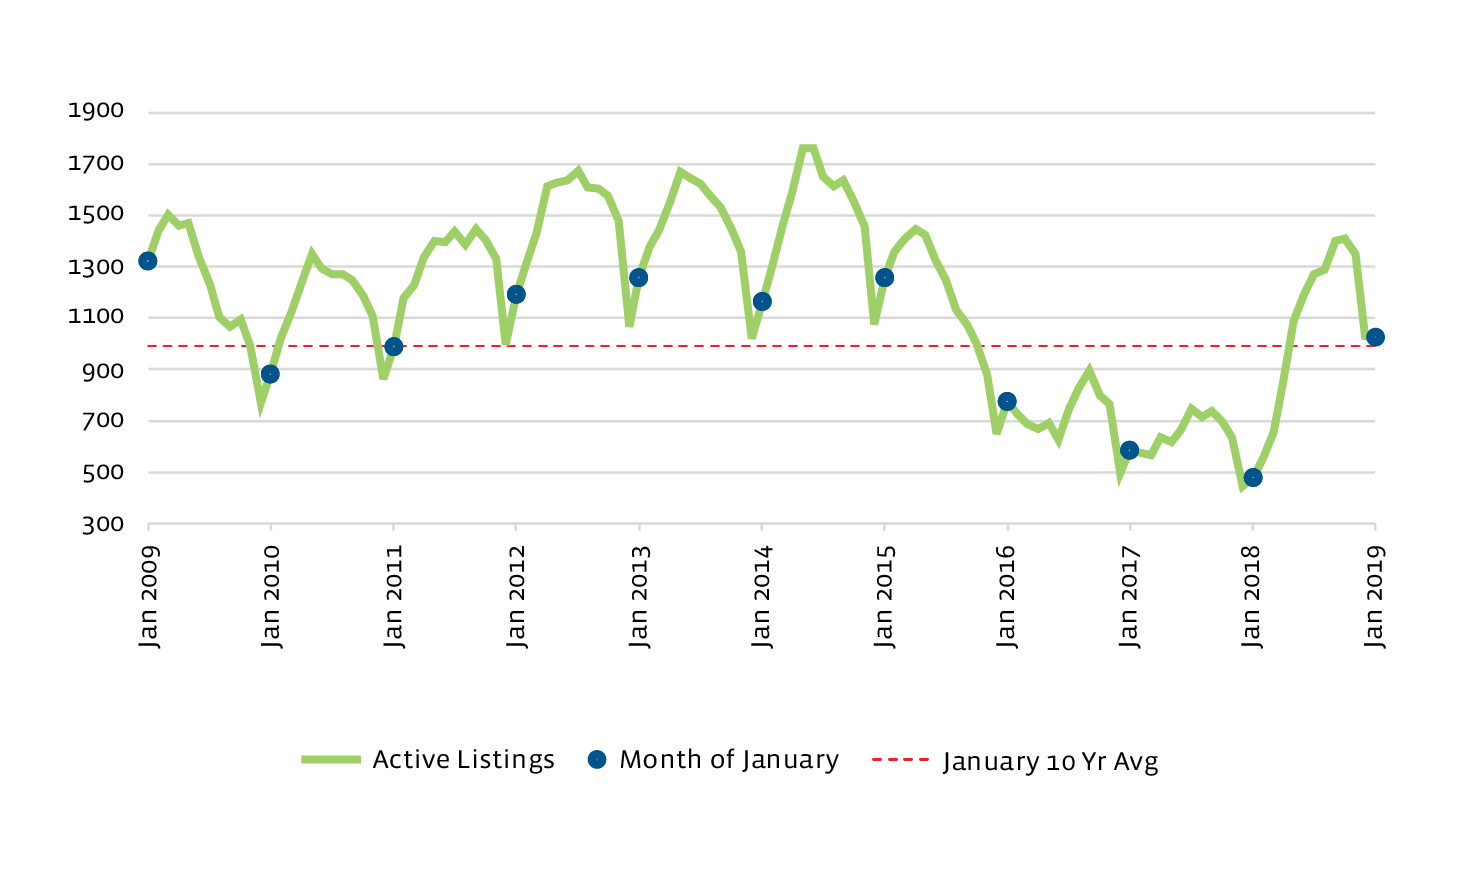
The chart below shows monthly townhouse inventory (green line) over a 10 year period, the inventory for each January (blue markers) and the 10 year average for the month of January (red line). You can see, while 2016 to 2018 were exciting, all the “spikes” in inventory we’ve seen are only bringing us back to what should be considered normal inventory levels.
Fraser Valley Townhome Inventory (Active Listings)
Sales to Active Listings Ratio Has Rebalanced
The sales to active listings ratio is used to determine whether we are in a seller’s, buyer’s or balanced market. As you can see below, the ratio jumped into an exceptionally strong seller’s market (anything over 20%) for a couple years starting in 2016 but that party’s over. If you look closely, we’re actually still sitting above the ratio of most Januarys from 2011 to 2015.
Sales to Active Listings Ratio (Fraser Valley Townhomes)
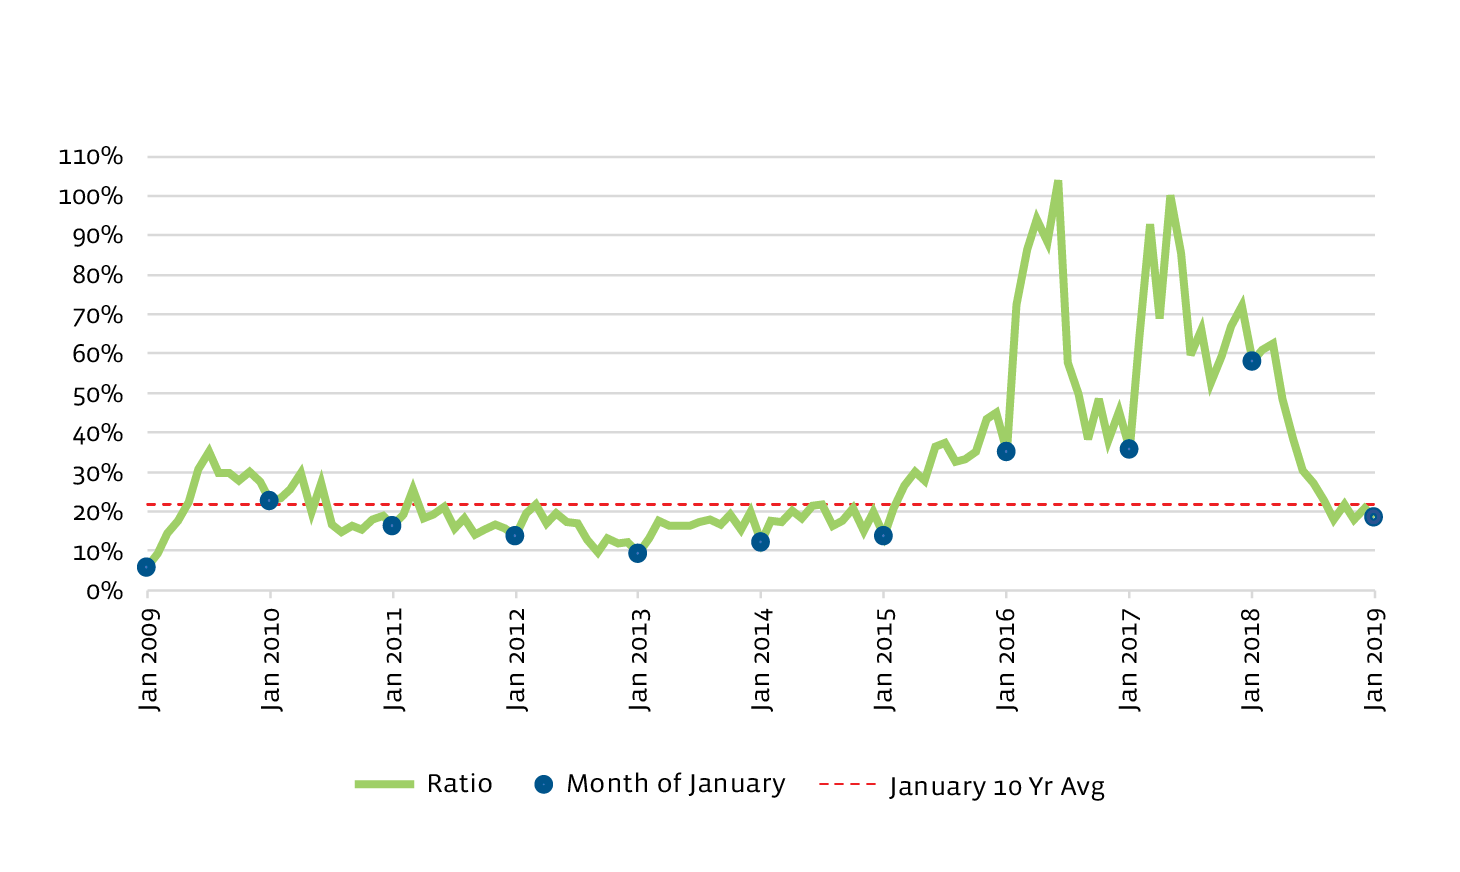
At the peak of the market you’ll notice this metric broke – sales to active listings exceeded 100%, which should be theoretically impossible. The reason this happened is that active listings are counted at on the last day of the month, not cumulatively added over the course of the month. So, when days on market plummeted and listings were selling in only a couple days or weeks, that data wasn’t captured.
Sale Price as a Percent of List Price Has Returned to Historical Levels
In mid-2016, the market was so hot that, on average, listings were selling for nearly 106% of their list price. You can see below that, as the market mellows out, listings are now selling for almost exactly the 10 year average of 96% of the original list price and that the downward trajectory is stabilizing.
Sale Price as a Percent of List Price (Fraser Valley Townhomes)
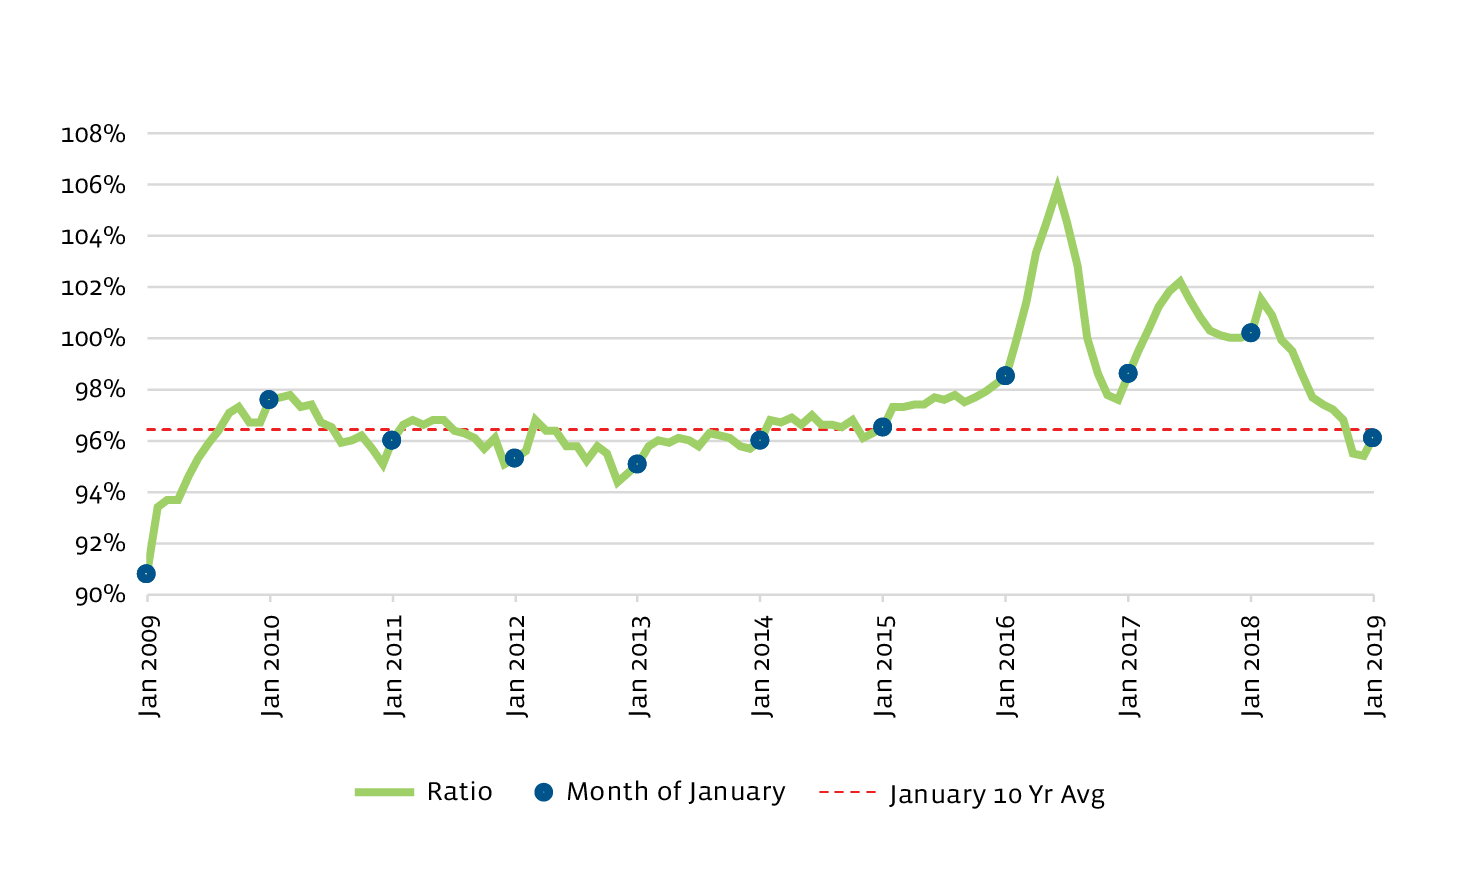
We have some reservations about the purity of this metric when it’s cited as an indicator of buyer competition. Sure, when there are multiple offers and a price is bid up this metric is impacted but what this metric hides is seller behaviour. For example, in our current declining market, the gap between list price and eventual sale price could be closing because sellers are beginning to list their properties at prices more in line with market value, rather than an increase in buyer competition. The point is that it’s not solely the quantity of buyers pursuing each listing that can drive this metric.
Days on Market is On Its Way Back Up
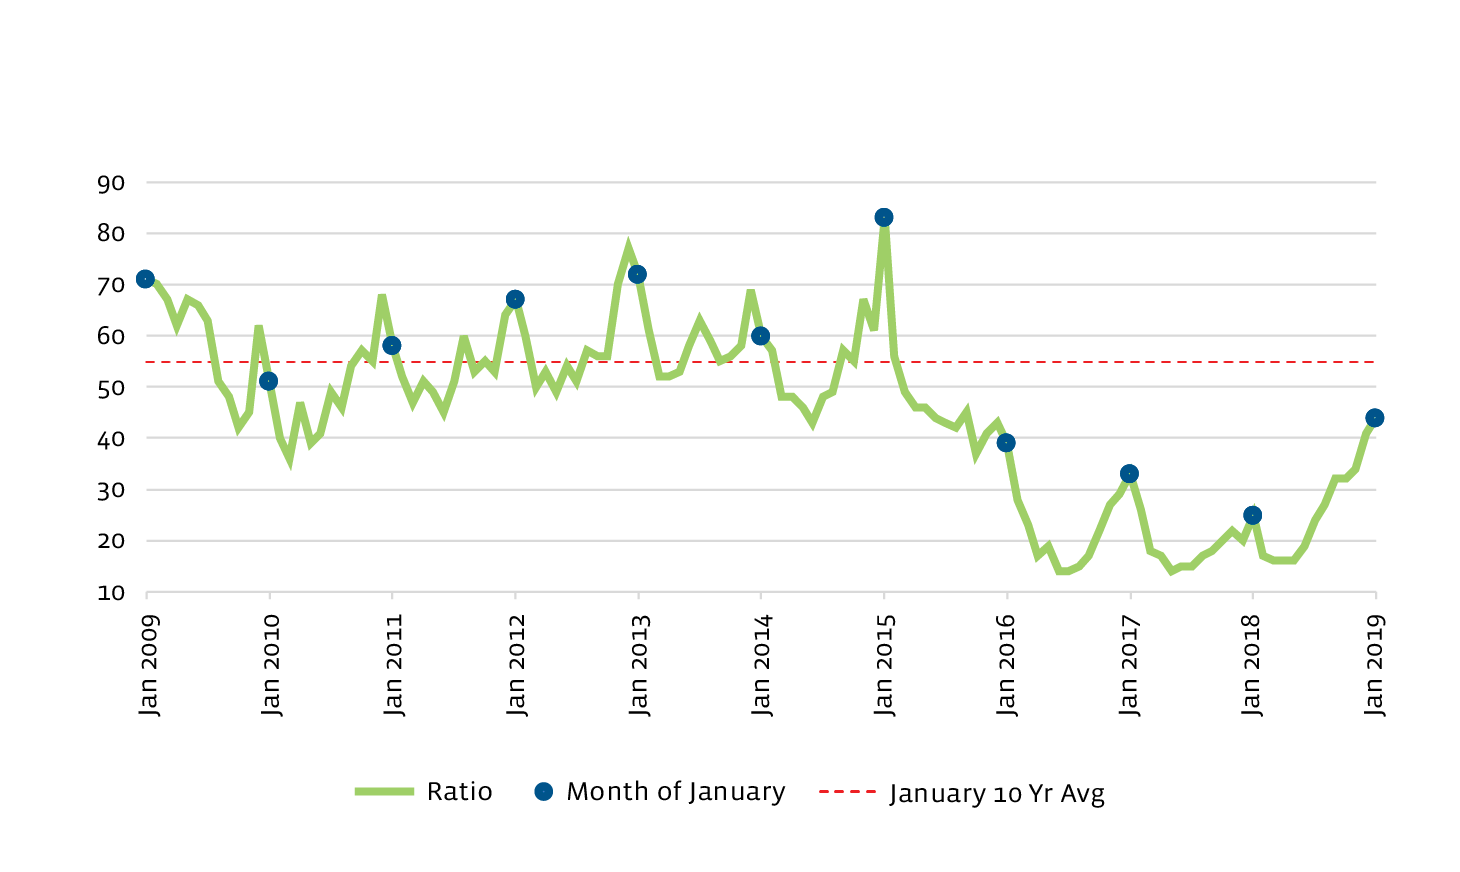
The average days on market for a townhome in the Fraser Valley is also reporting significant increases month-over-month, but as you can see below, the peak of the market had homes selling at speeds we haven’t experienced at any other time in the past decade.
Average Days on Market (Fraser Valley Townhomes)
What does all this mean?
When we zoom out and look at the last decade of key stats that are monitored on a monthly basis, we’re able to turn down the volume on all the noise in the media and see that the market isn’t falling apart but rather reverting to its mean, or stabilizing.
This reversion and stability underscore the increase in investor and builder confidence that we are feeling return to the market, just since the beginning of February. End-product sale prices and land values have come down but builders that were active in 2012 to 2014 recognize the familiar market temperature and are preparing to make land acquisition commitments again as they stay focused on the long game.
As we mentioned, if you don’t already receive our residential development land newsletter with our monthly insights on the Board’s stats and what it means for the land market, shoot us an email ([email protected]) and we’ll get you on the mailing list.
Sources: Fraser Valley Real Estate Board
Note: This representation is based in whole or in part on data generated by the Fraser Valley Real Estate Board which assumes no responsibility for its accuracy.
