Infographic: Greater Vancouver Residential Real Estate February 2024
In February, Metro Vancouver’s real estate market saw a notable increase in new listings, offering prospective buyers a more robust selection. Despite a somewhat hesitant start to the year for home sellers, the market showed signs of vitality with a notable rise in new properties hitting the market. This surge in listings, particularly in detached, attached, and apartment properties, helped alleviate some pressure that had built up in January, providing buyers with increased options as the spring and summer markets approach.
These residential market statistics from the Real Estate Board of Greater Vancouver provide insight into the current state of the residential home market, including home values, which directly impact the development land market. Contact us today if you would like to learn what your property is worth on the development land market.
KEY TAKEAWAYS FROM February 2024 GREATER VANCOUVER RESIDENTIAL MARKET
- February saw a significant 31% increase in new listings compared to the same period last year.
- Despite the increase in new listings, standing inventory levels were not high enough relative to the pace of sales to mitigate price acceleration in February.
- Most segments of the market moved into sellers’ territory.
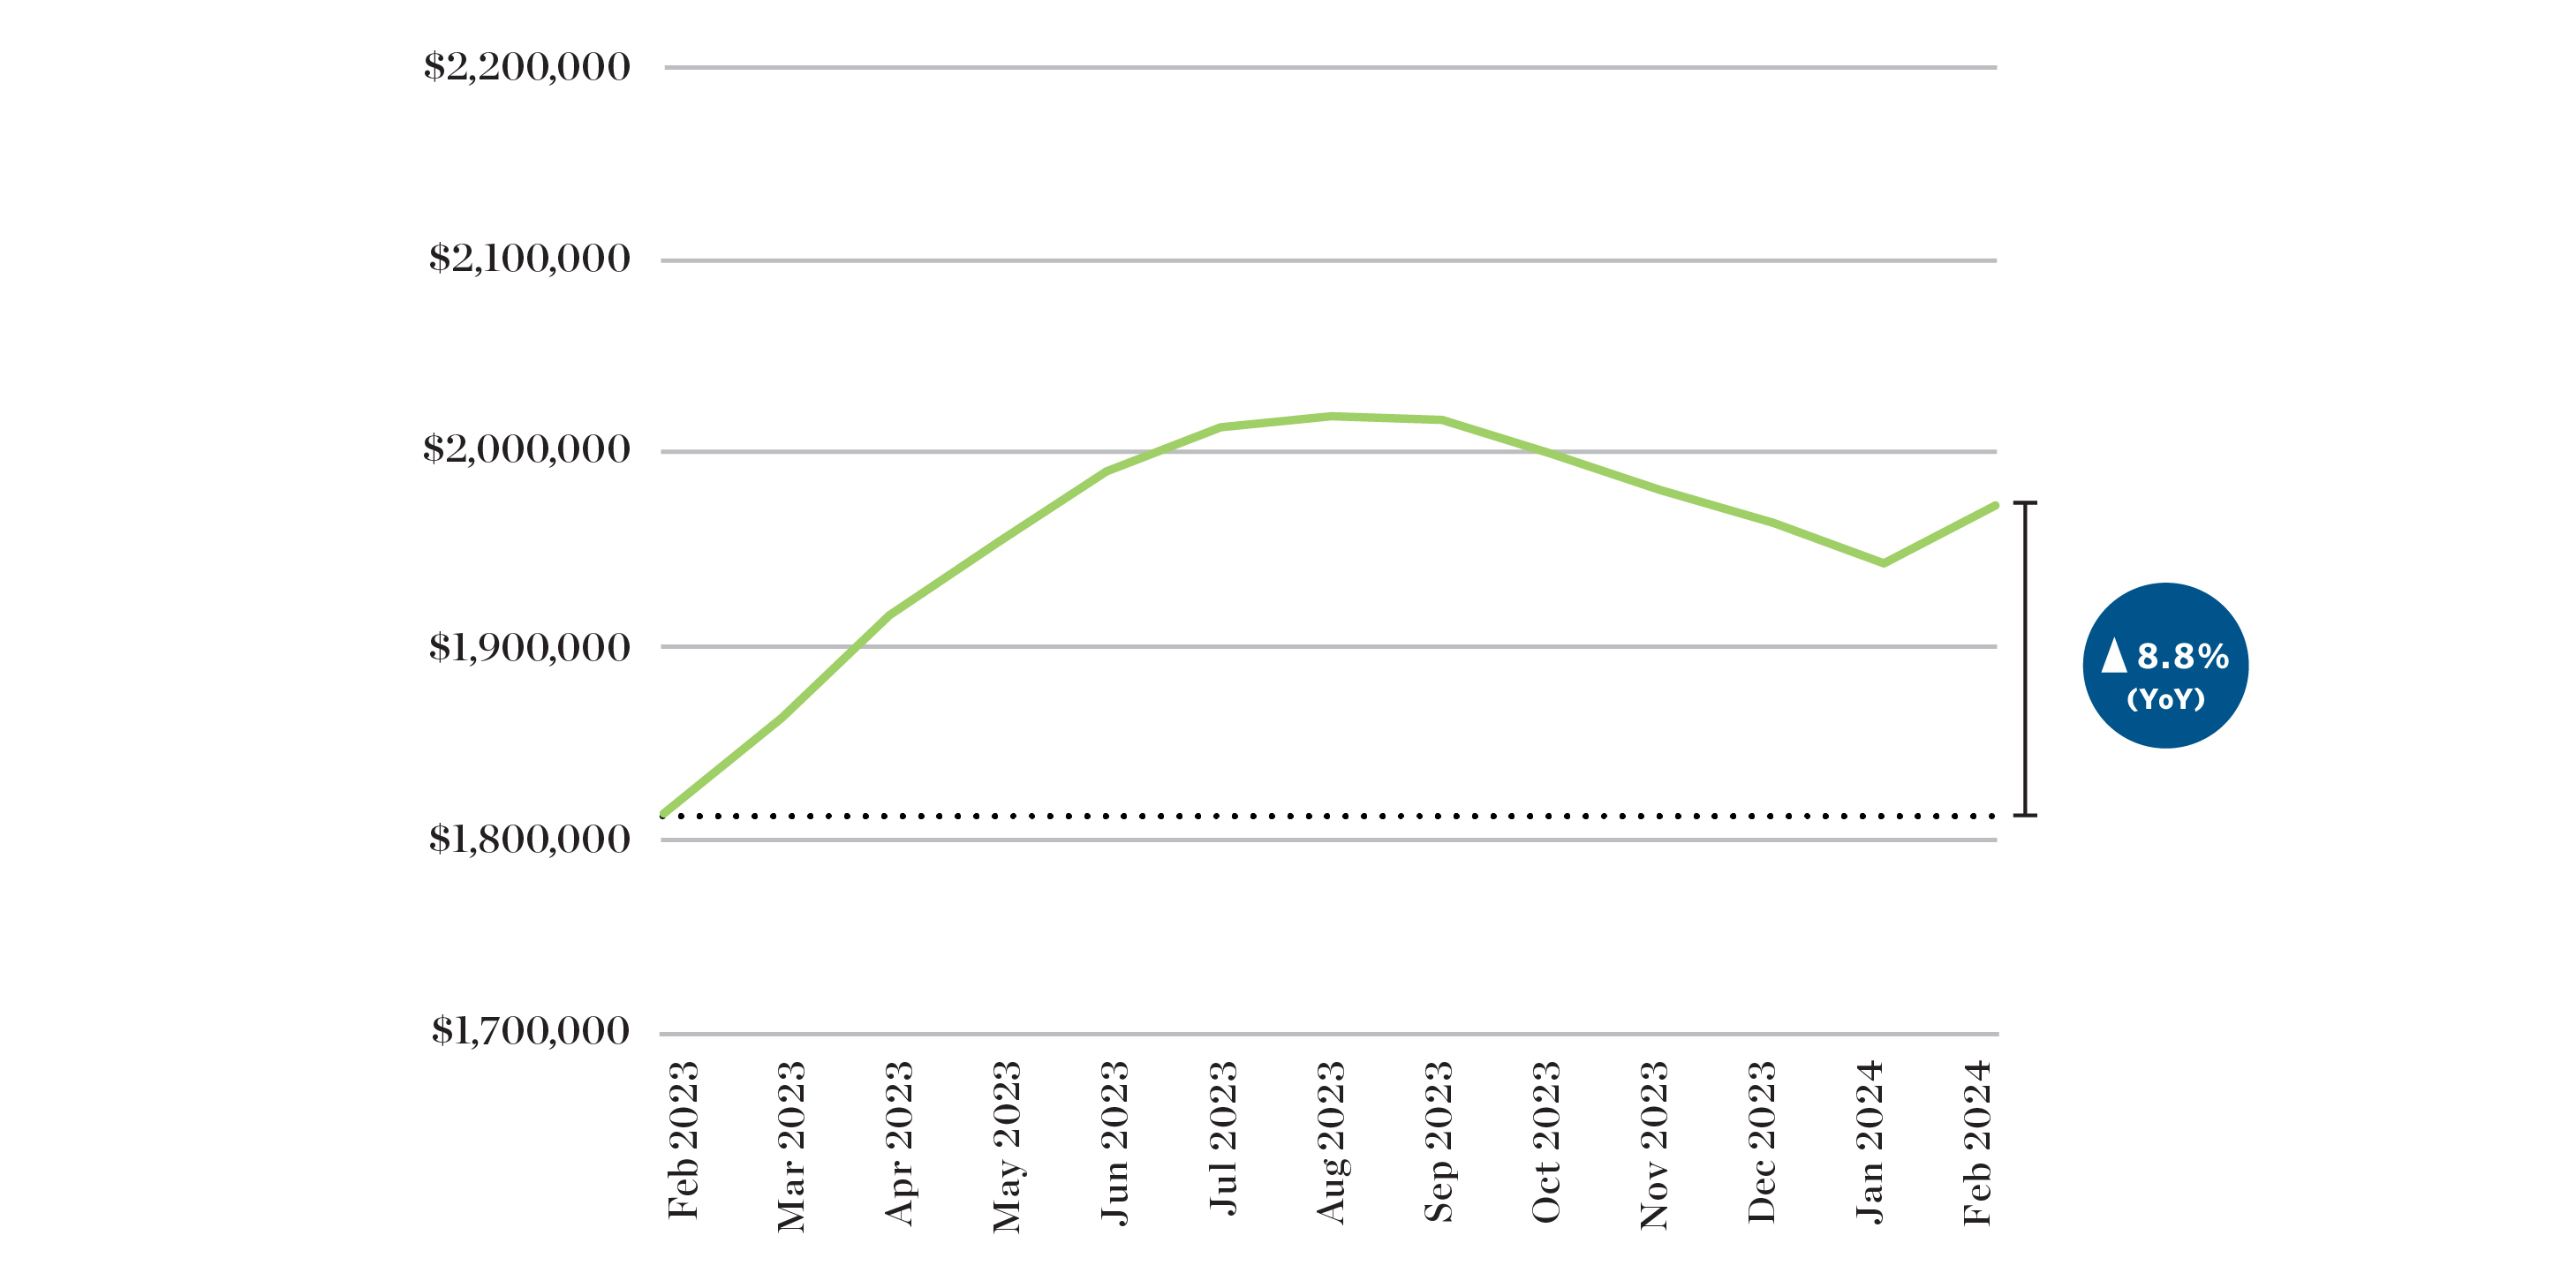
HPI Benchmark Price of Detached Homes
In February 2024, sales of detached homes in Metro Vancouver showed a notable increase of 8.3% compared to the same period last year, with 560 transactions recorded. The benchmark price for a detached homes rose to $1,972,400, marking a substantial 8.8% increase from February 2023 and a further 1.2% increase compared to January 2024. These figures suggest continued demand and upward price trends in the detached home segment of the market.
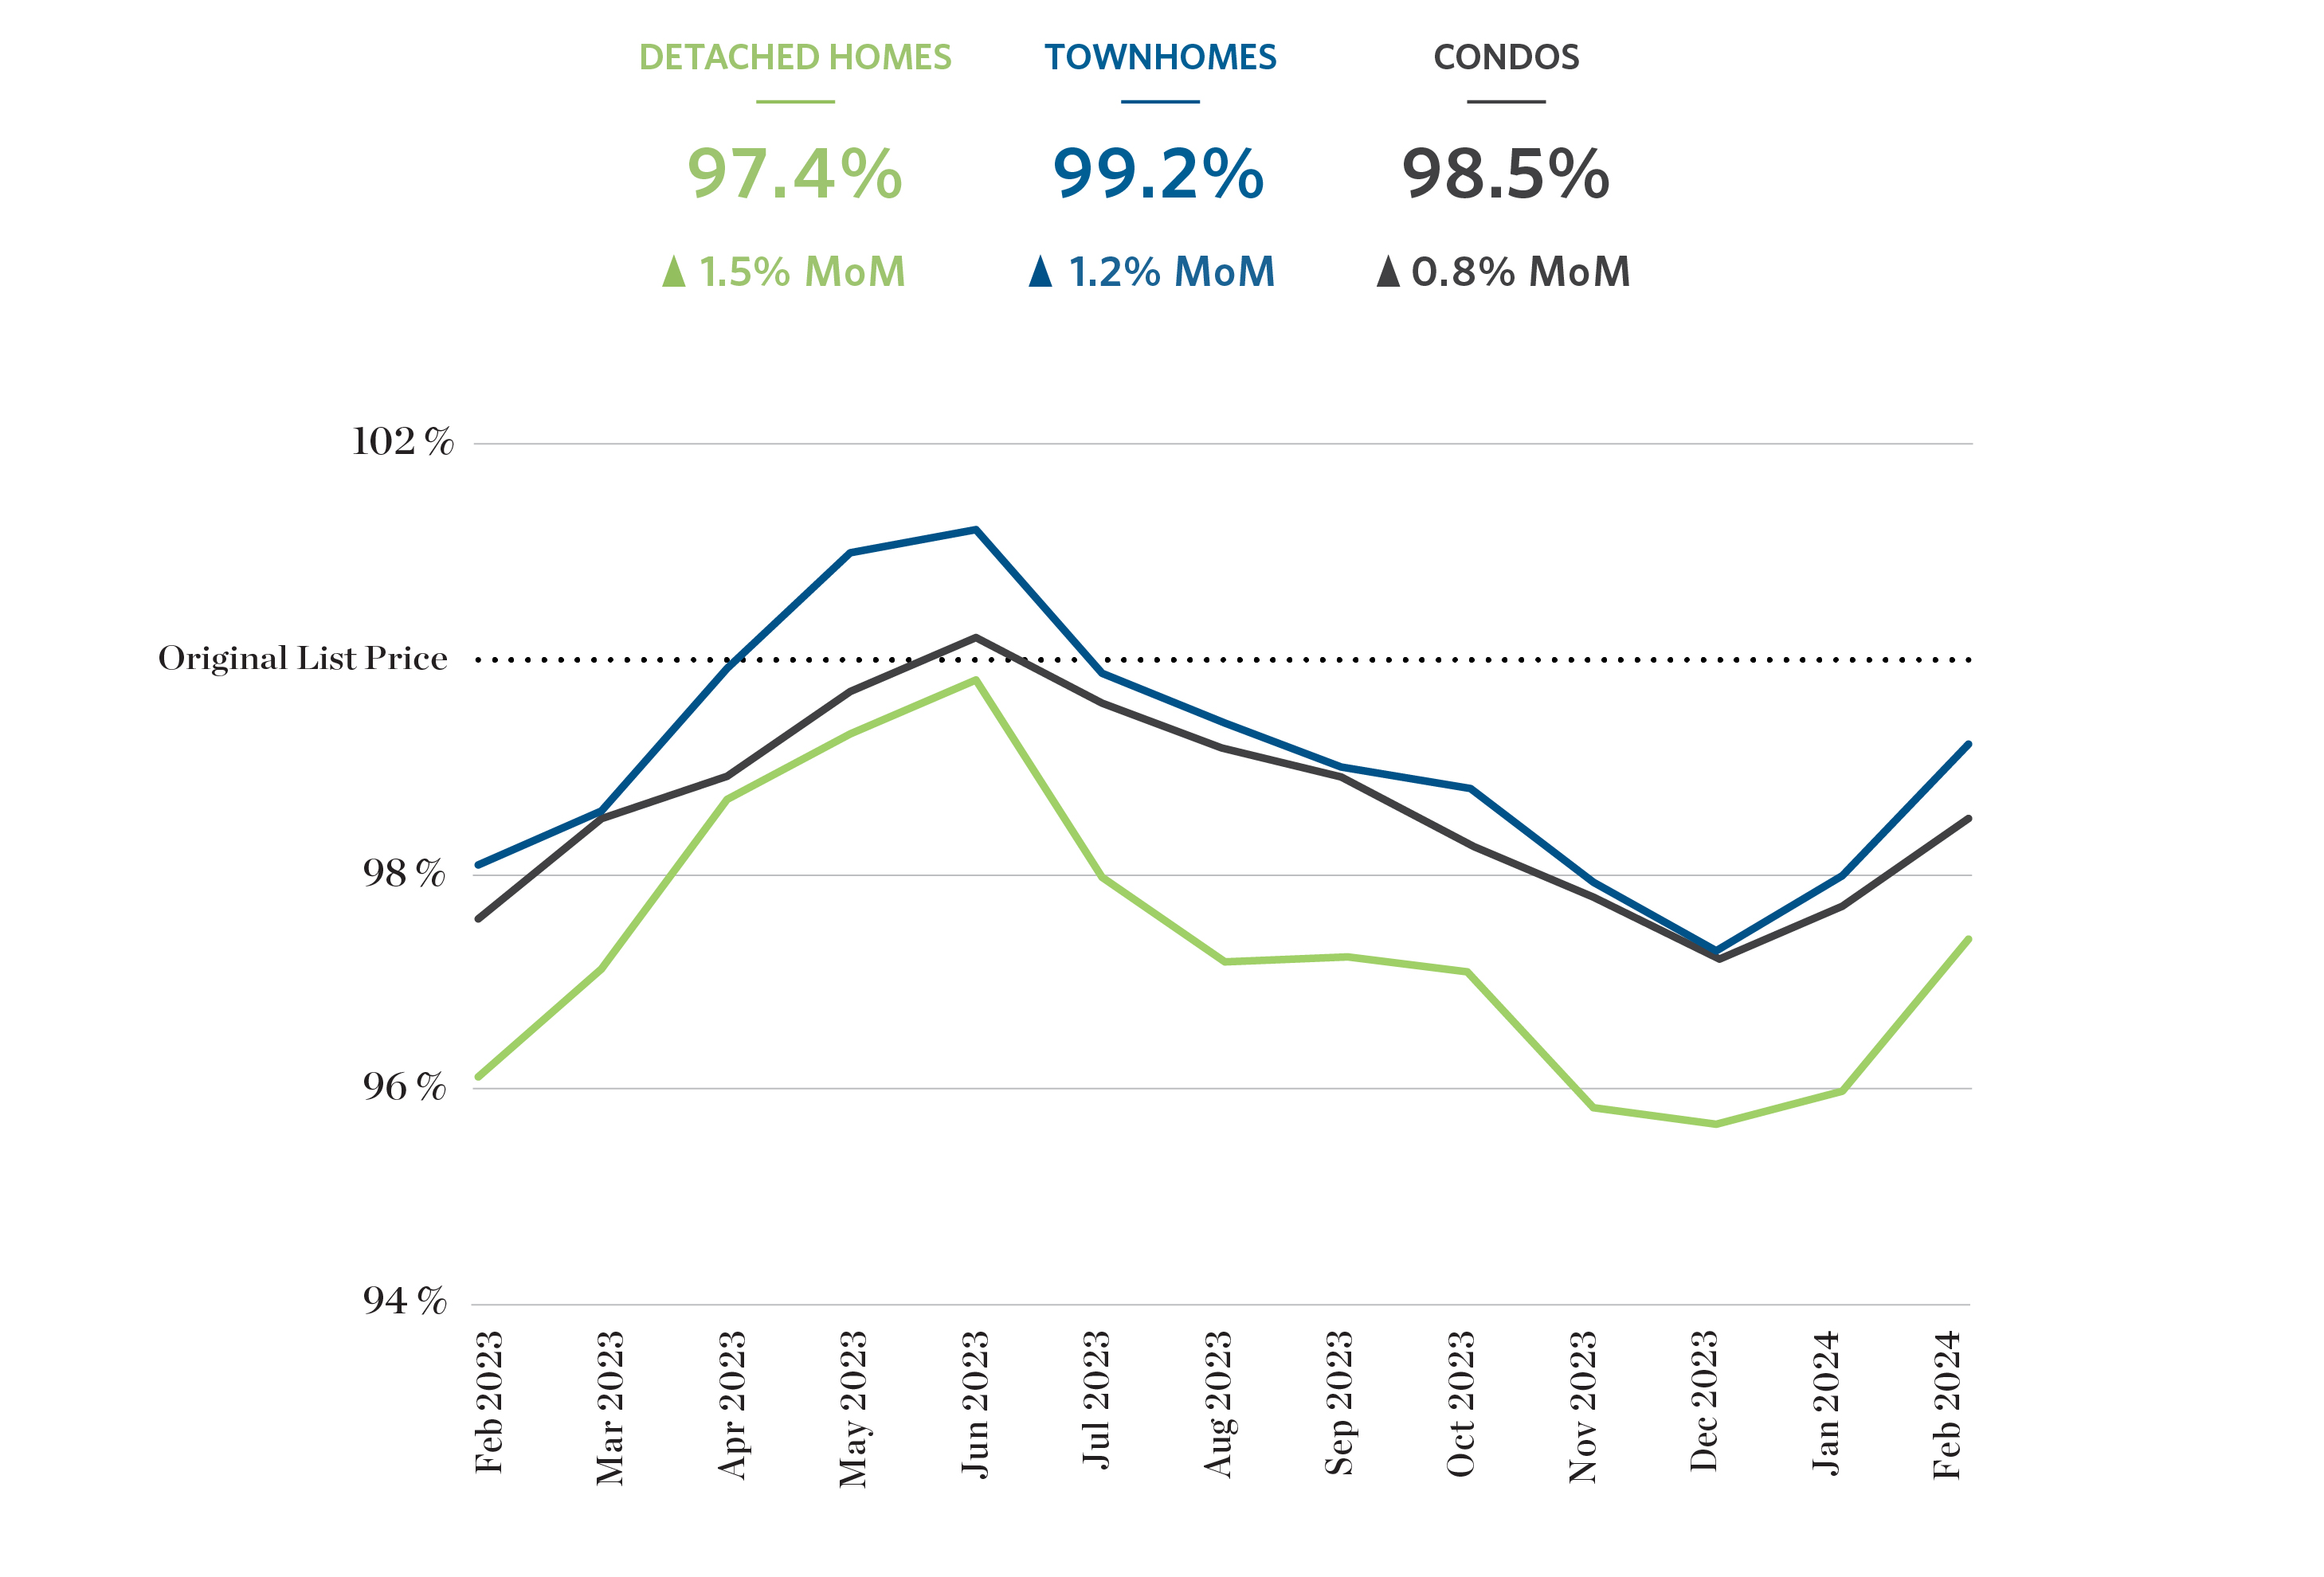
Sale Price As a Percent of Original List Price
The percentage of original sales price remained strong across property types in Metro Vancouver. Detached homes achieved 97.4%, indicating a high level of value retention for sellers. Townhomes fared even better, reaching 99.2%, showcasing the robust demand and competitive pricing in this segment. Condos also performed well, achieving 98.5% of the original sales price.
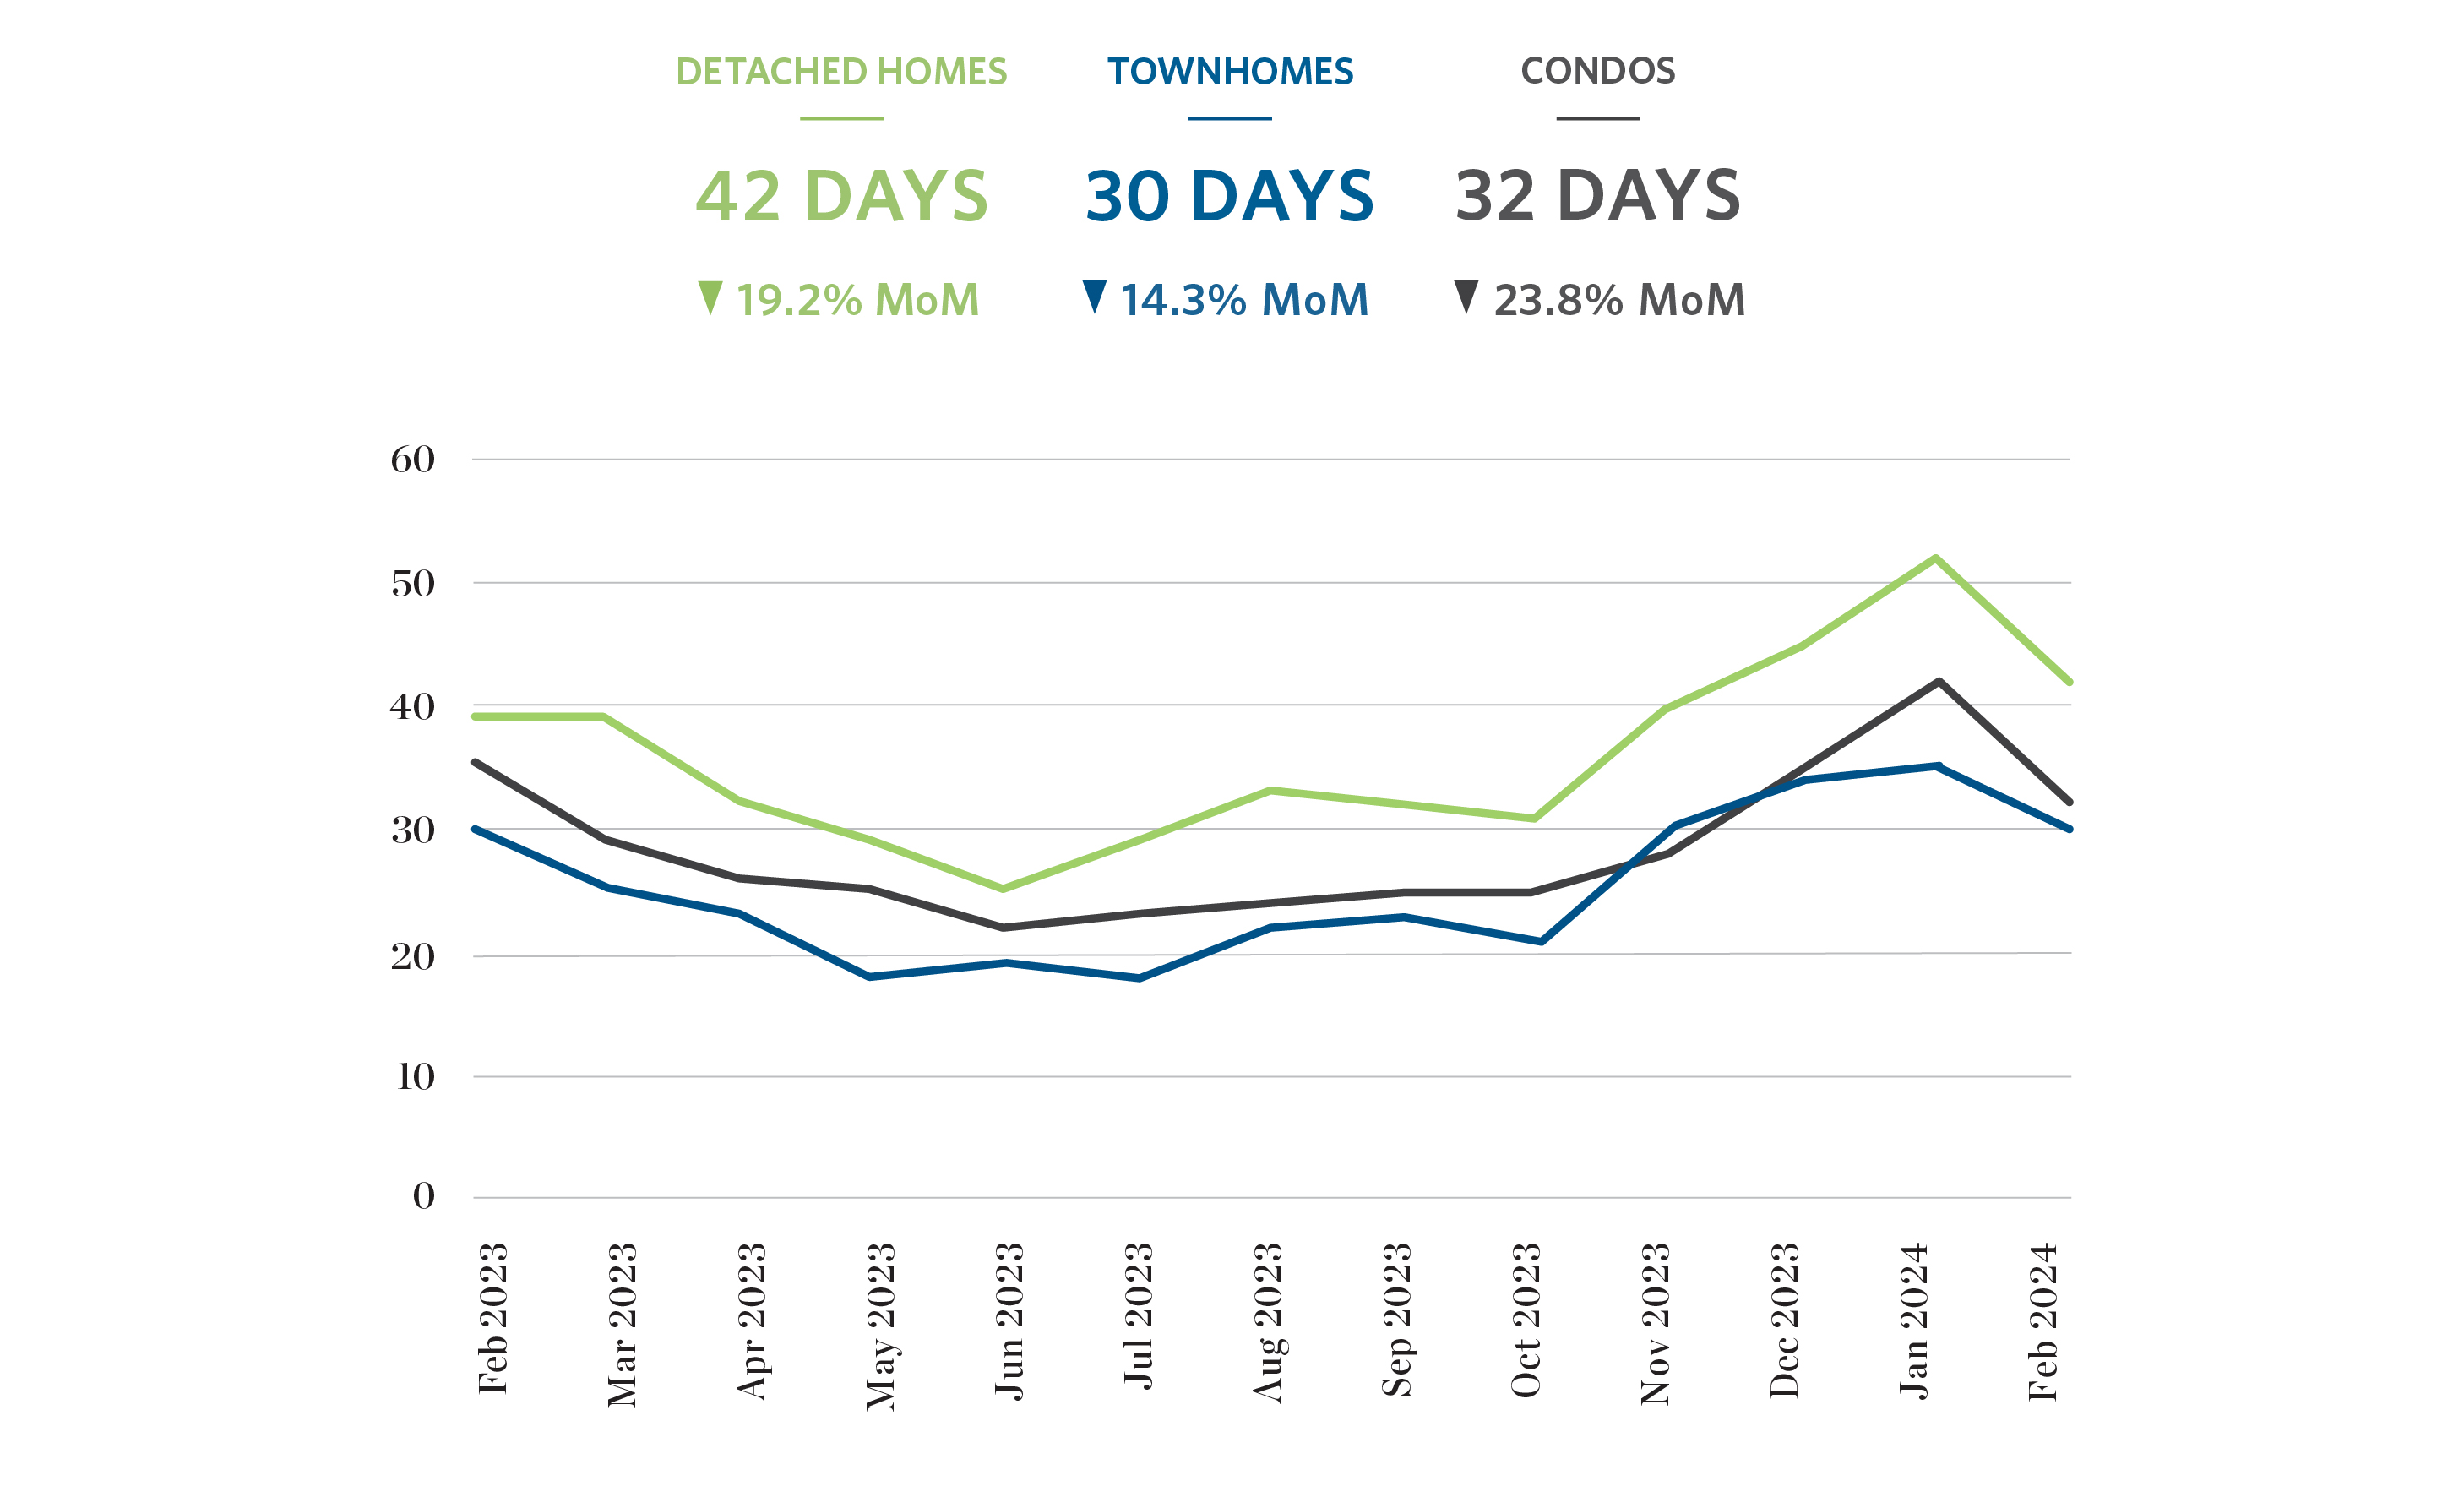
Days on Market
Detached homes took an average of 42 days to sell, indicating a steady pace of transactions. Townhomes moved slightly faster, spending an average of 30 days on the market, suggesting strong demand in this segment. Condos also saw relatively quick turnover, with an average of 32 days on the market, indicating continued interest from buyers.
Featured Homes
Looking for a new home? Check out these featured new homes courtesy of our affiliate company, Breakside Real Estate Group.

GREATER VANCOUVER RESIDENTIAL REAL ESTATE: February 2024 statistics in infographics
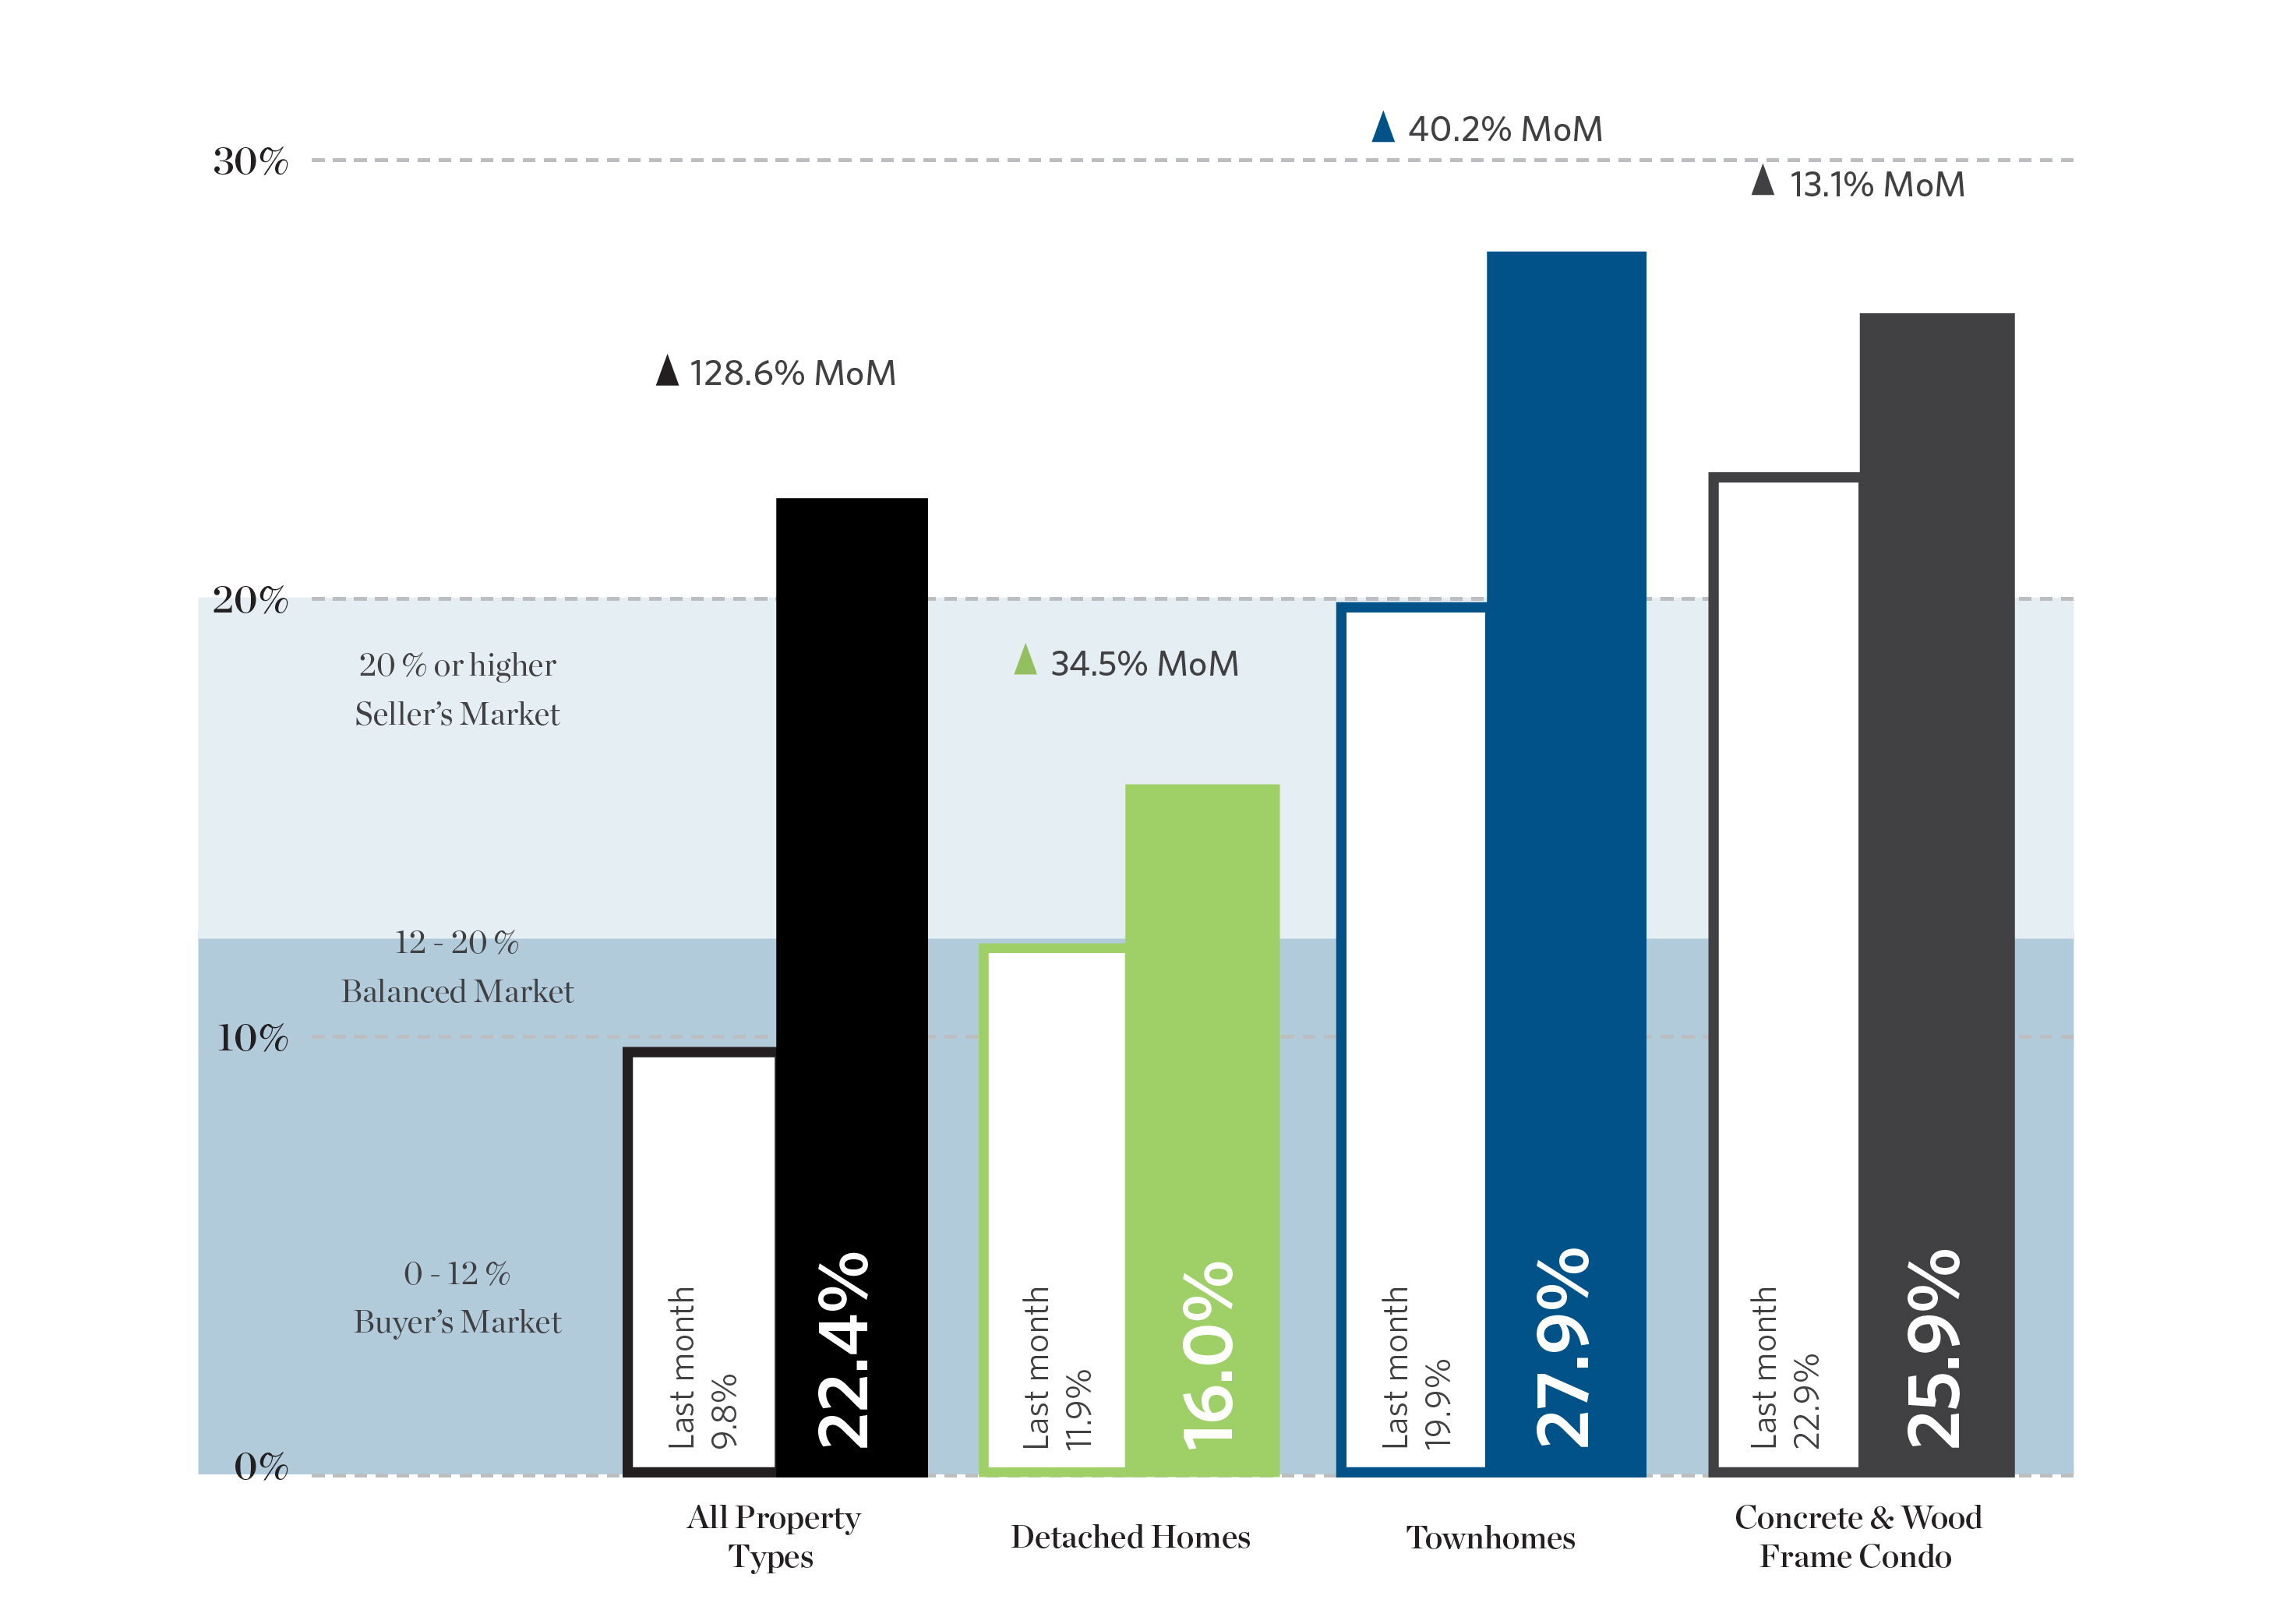
Sales To Active Listings Ratio
Detached homes had a sales-to-active listings ratio of 16%, indicating a balanced market for this segment. Townhouses showed stronger demand, with a ratio of 27.9%, suggesting a seller’s market. Condos had a ratio of 25.9%, also indicating a seller’s market. Overall, the market had a sales-to-active listings ratio of 22.4%, reflecting a market where demand slightly outpaced supply, particularly in the townhouse and condo segments.
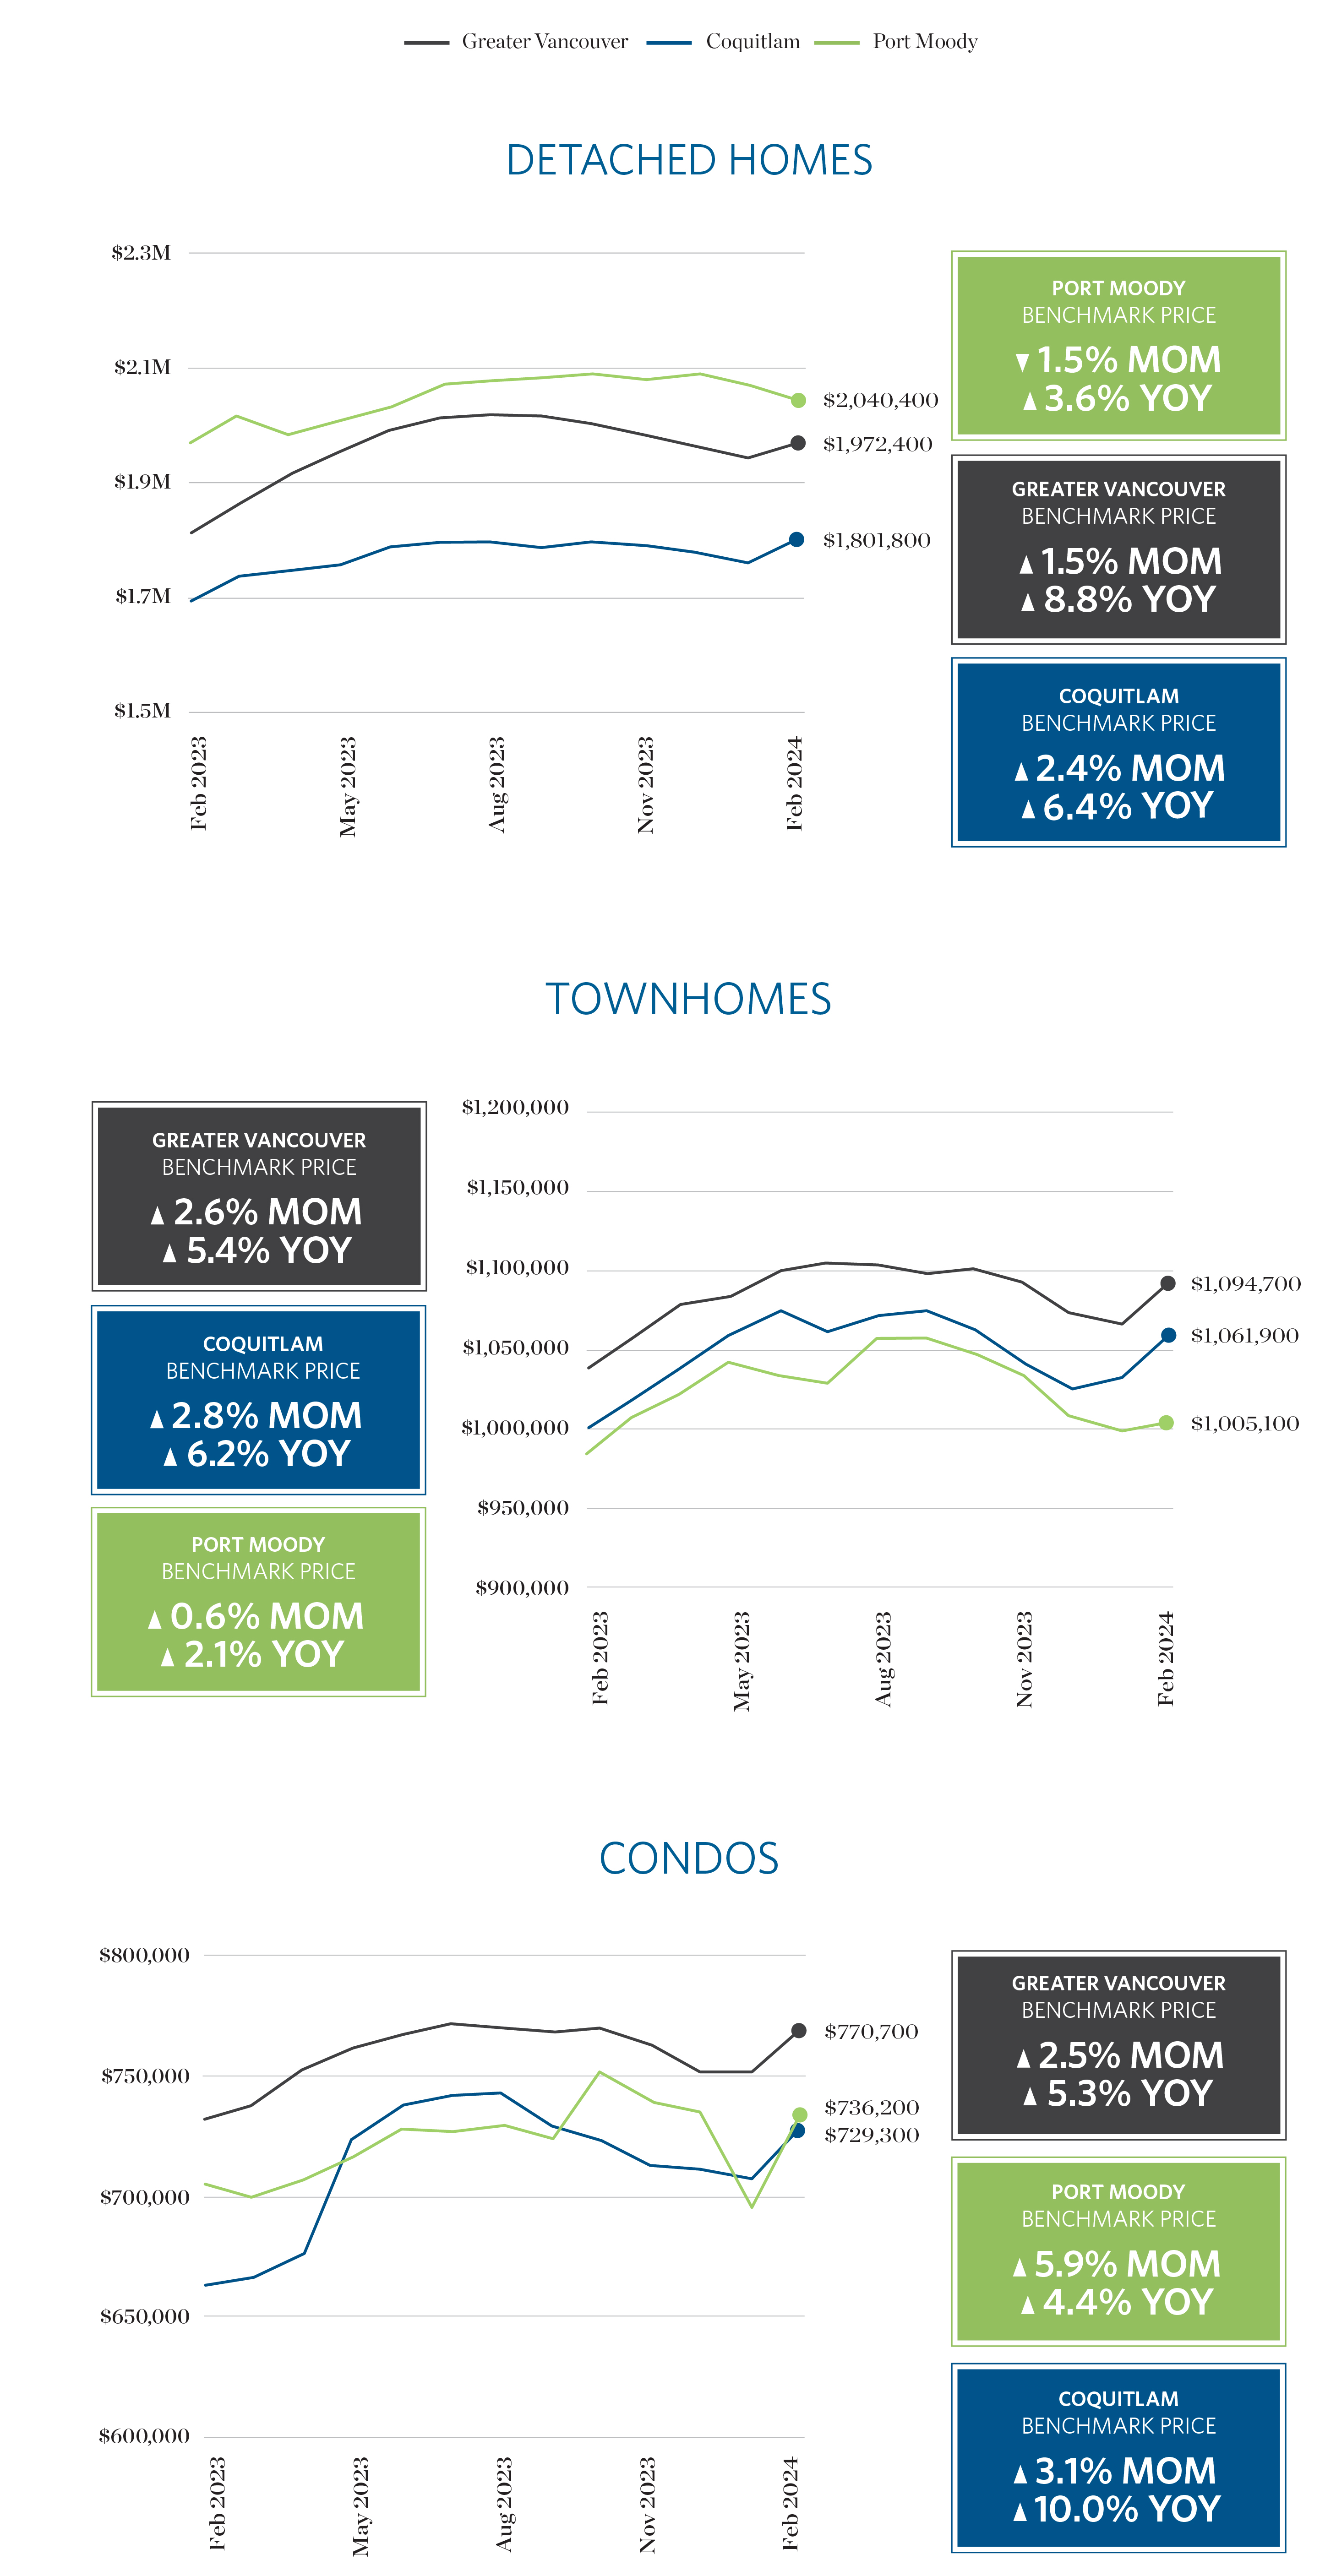
HPI Benchmark Prices
The Home Price Index (HPI) measures the price of a benchmark, or typical, property in a given market and is not influenced by the change in composition of properties sold, which can fluctuate quite significantly from month to month. As a result, this metric is a more pure and stable representation of market price change than average or median prices.
The composite benchmark price for all residential properties rose to $1,183,300, a 4.5% increase from February 2023 and a 1.9% increase from January 2024. Detached homes reached $1,972,400, up 8.8% from February 2023 and 1.5% from January 2024. Apartments rose to $770,700, showing a 5.3% increase from February 2023 and a 2.5% increase from January 2024. Townhouses hit $1,094,700, marking a 5.4% increase from February 2023 and a 2.6% increase from January 2024.
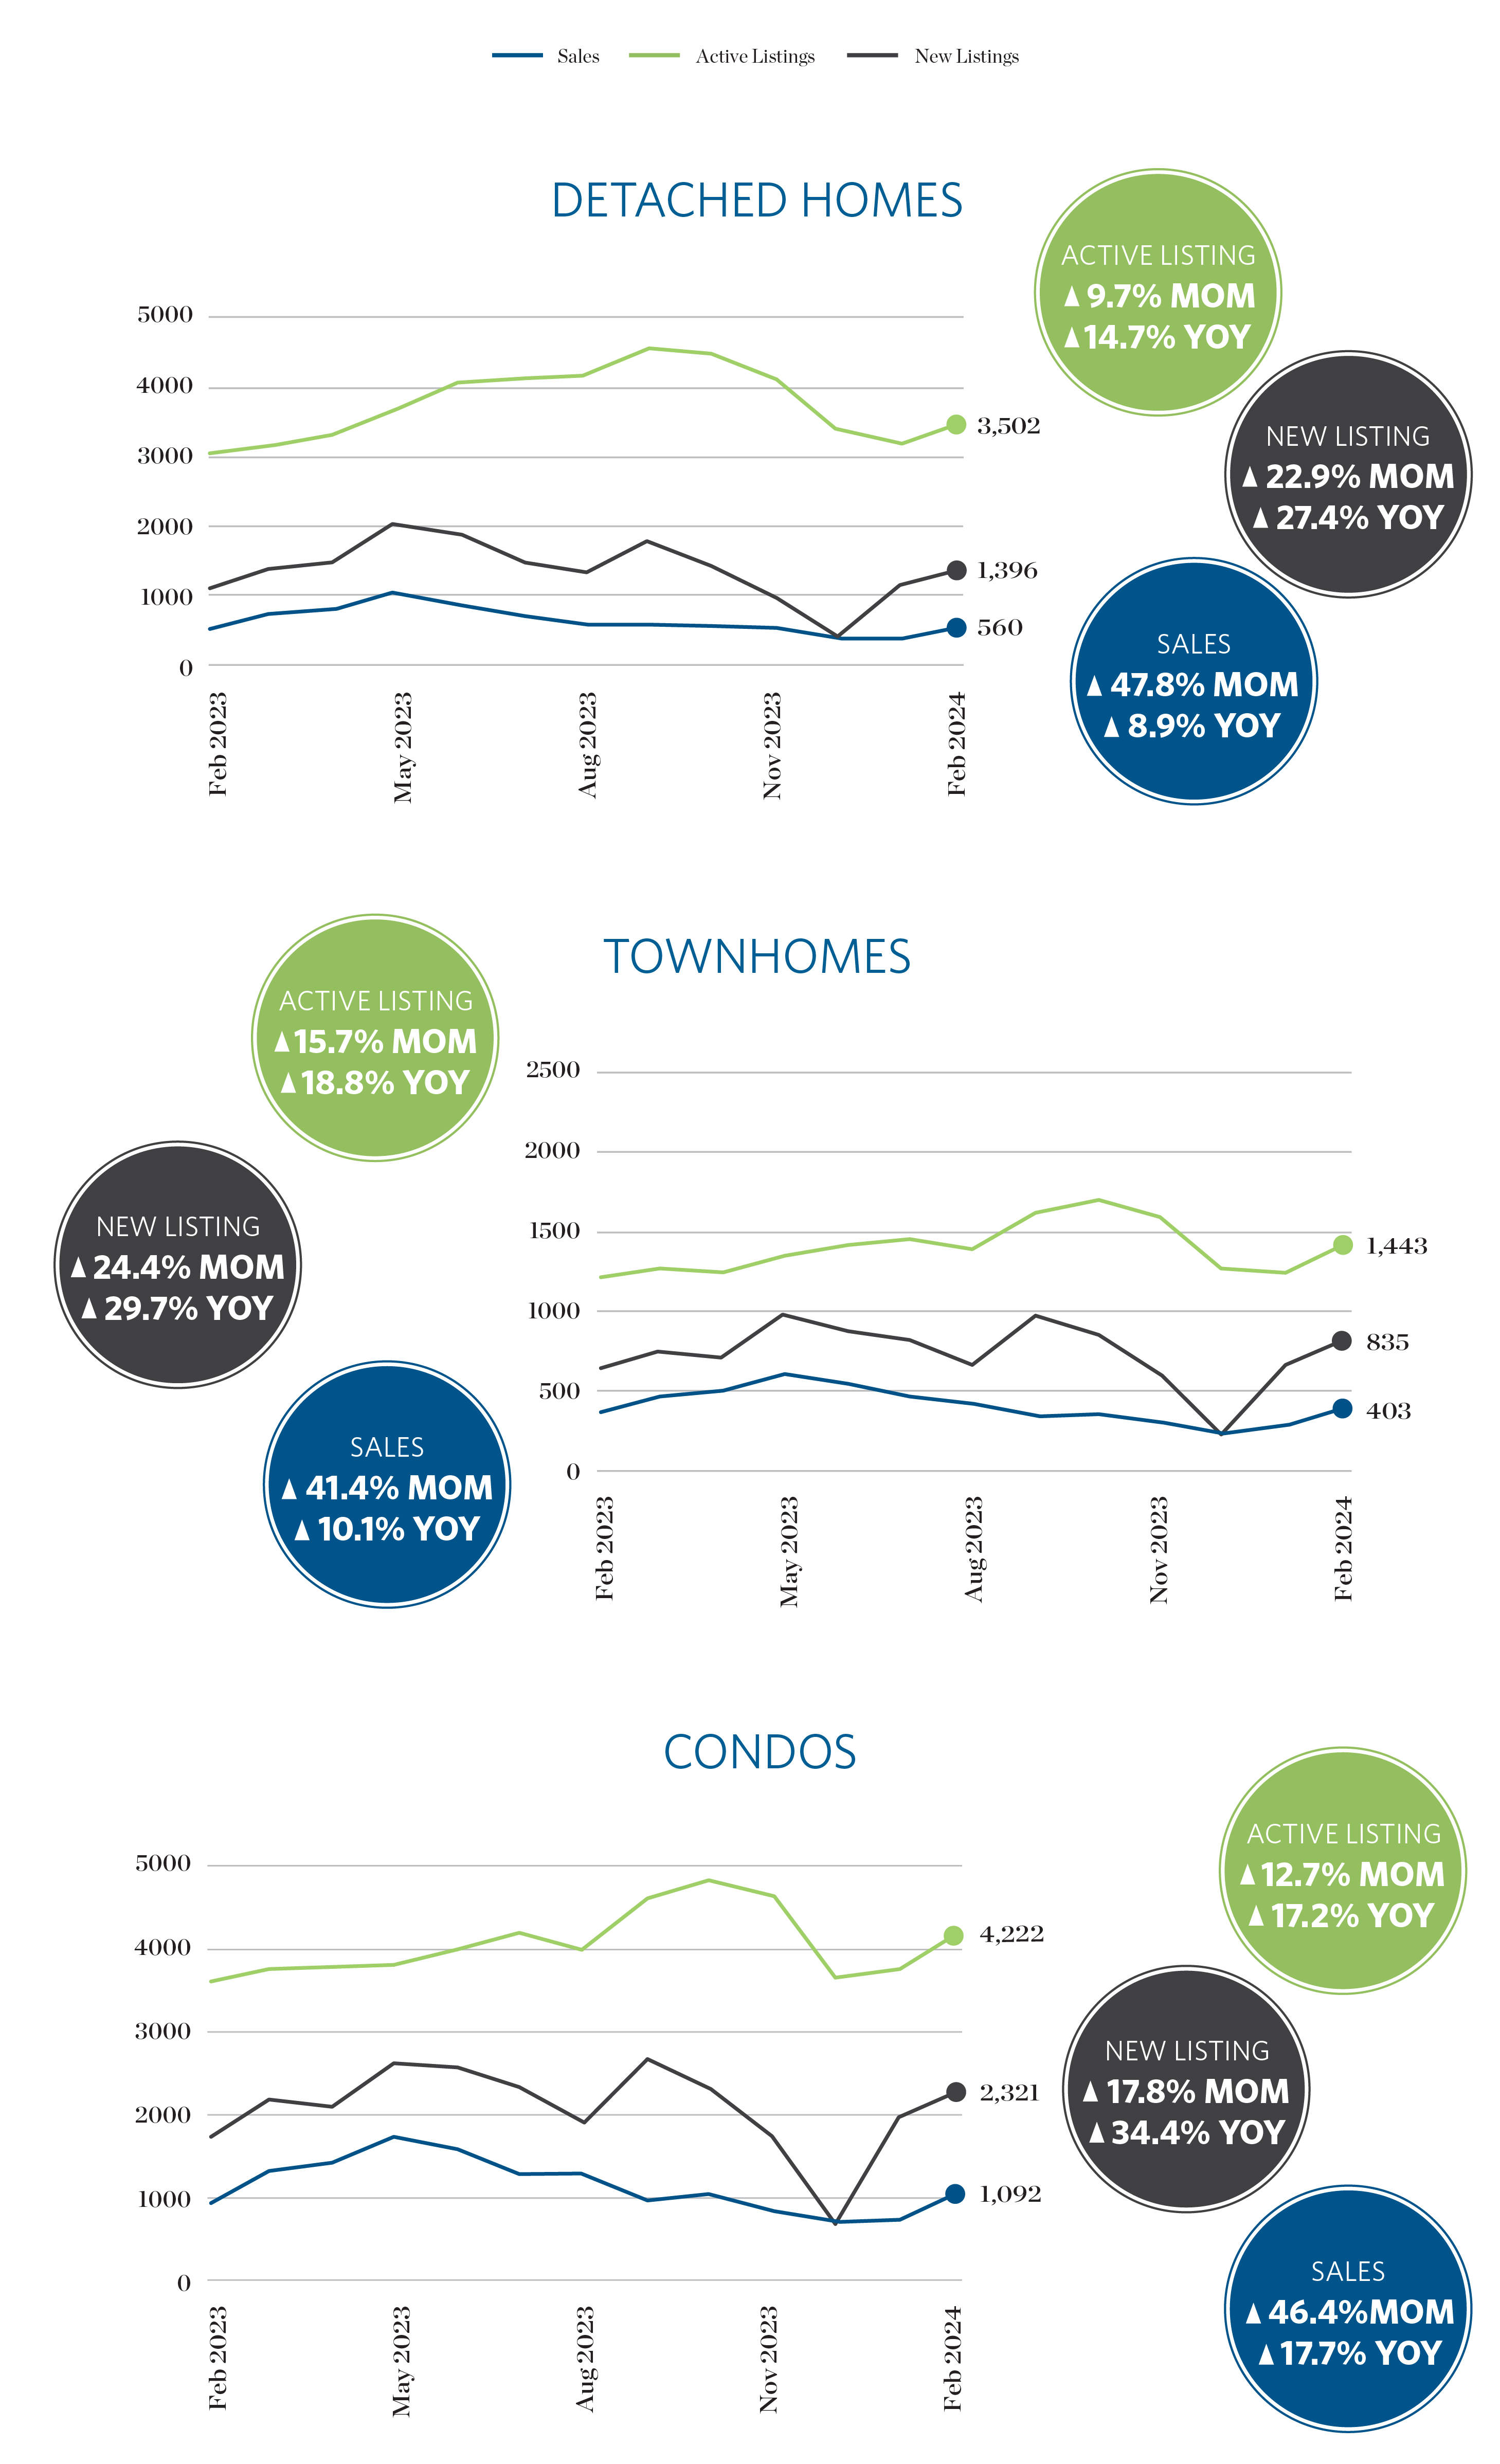
Sales • New Listings • Active Listings
In February 2024, Metro Vancouver’s real estate market saw a significant increase in new listings, which rose by 31% compared to the previous year. Residential sales also saw a notable uptick, totaling 2,070, marking a 13.5% increase from February 2023. However, this figure was 23.3% below the 10-year seasonal average. The total number of properties listed for sale increased by 16.3% compared to February 2023, reaching 9,634. The sales-to-active listings ratio for February 2024 was 22.4%, indicating a balanced market.
Further Reading
View the Real Estate Board of Greater Vancouver’s entire stats package for February 2024 here.
Please note: areas covered by the Real Estate Board of Greater Vancouver include: Whistler, Sunshine Coast, Squamish, West Vancouver, North Vancouver, Vancouver, Burnaby, New Westminster, Richmond, Port Moody, Port Coquitlam, Coquitlam, Pitt Meadows, Maple Ridge, and South Delta.
Sources
Sources: Breakside Real Estate Group, Real Estate Board of Greater Vancouver
This representation is based in whole or in part on data generated by the Real Estate Board of Greater Vancouver which assumes no responsibility for its accuracy.
