North of the Fraser Residential Real Estate: April 2018 Infographic
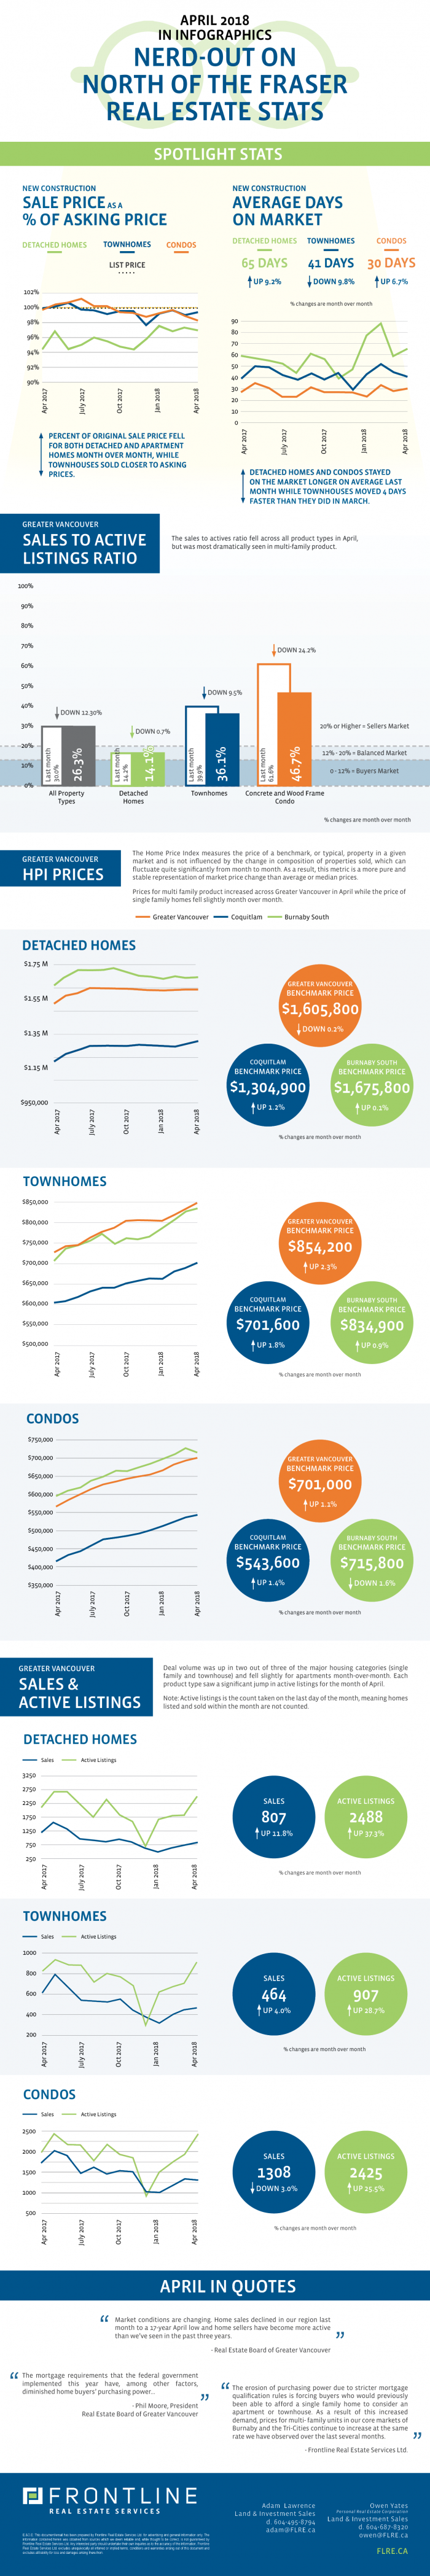
The April statistics are in from the Real Estate Board of Greater Vancouver and the initial impression is that the residential market is in flux across Vancouver. Benchmark prices are up, sales volume is down, and the number of active listings is up.
Despite the increase in available inventory and the decrease of qualified buyers, due in part to the changes in mortgage qualifications, the sales to active listings ratios for all product types is 26.3%. This is still well above the 20% threshold where analysts say home prices experience upward pressure and we enter what is described as a seller’s market. Looking at the three major housing categories individually, apartment and townhouse product remains in a seller’s markets, while detached homes came in at 14.1%, a figure indicative of a more balanced market.
Despite the relatively quiet Spring market, the benchmark price of all residential property in Greater Vancouver increased by 0.7% compared to March. Townhouses and condos saw modest benchmark price increases month over month while detached home prices declined very slightly (-0.2%) compared to March. Interestingly, the price depreciation in single family was not distributed equally across all municipalities as only 7 of the 20 sub markets the Board reports on experienced price decreases. The markets hit hardest with these price declines were: West Vancouver (-2.0%), Richmond (-1.4%), Vancouver West (-1.3%) and North Vancouver (-1.2%).
With the looming slow down in the single-family market, many of our developer clients have shifted their focus toward acquiring apartment and townhome sites located within walking distance of a SkyTrain station or other transit options. While these sites tend to come at a premium, municipal migration trends and the millennial homebuyers’ willingness to forego additional space for a convenient location have resulted in strong absorption and revenue numbers for end product. We expect this trend to continue as these communities begin to redevelop and mature, becoming attractive to home buyers with more discerning tastes.
Check out our curated summary of the Greater Vancouver Real Estate Board’s September stats in infographics below.
Please note: areas covered by the Real Estate Board of Greater Vancouver include: Whistler, Sunshine Coast, Squamish, West Vancouver, North Vancouver, Vancouver, Burnaby, New Westminster, Richmond, Port Moody, Port Coquitlam, Coquitlam, Pitt Meadows, Maple Ridge, and South Delta.
View the Real Estate Board of Greater Vancouver’s entire stats package for April 2018 here.
This representation is based in whole or in part on data generated by the Real Estate Board of Greater Vancouver which assume no responsibility for its accuracy.
