Fraser Valley Residential Real Estate: May 2018 Infographic
The Fraser Valley Real Estate Board’s stats are out for May. Prices continue to decelerate as activity moderates and inventory rebuilds following a couple years of historically low inventory. Incidentally, active listings are still only 78% of what they were in May of 2015 just before it plummeted.
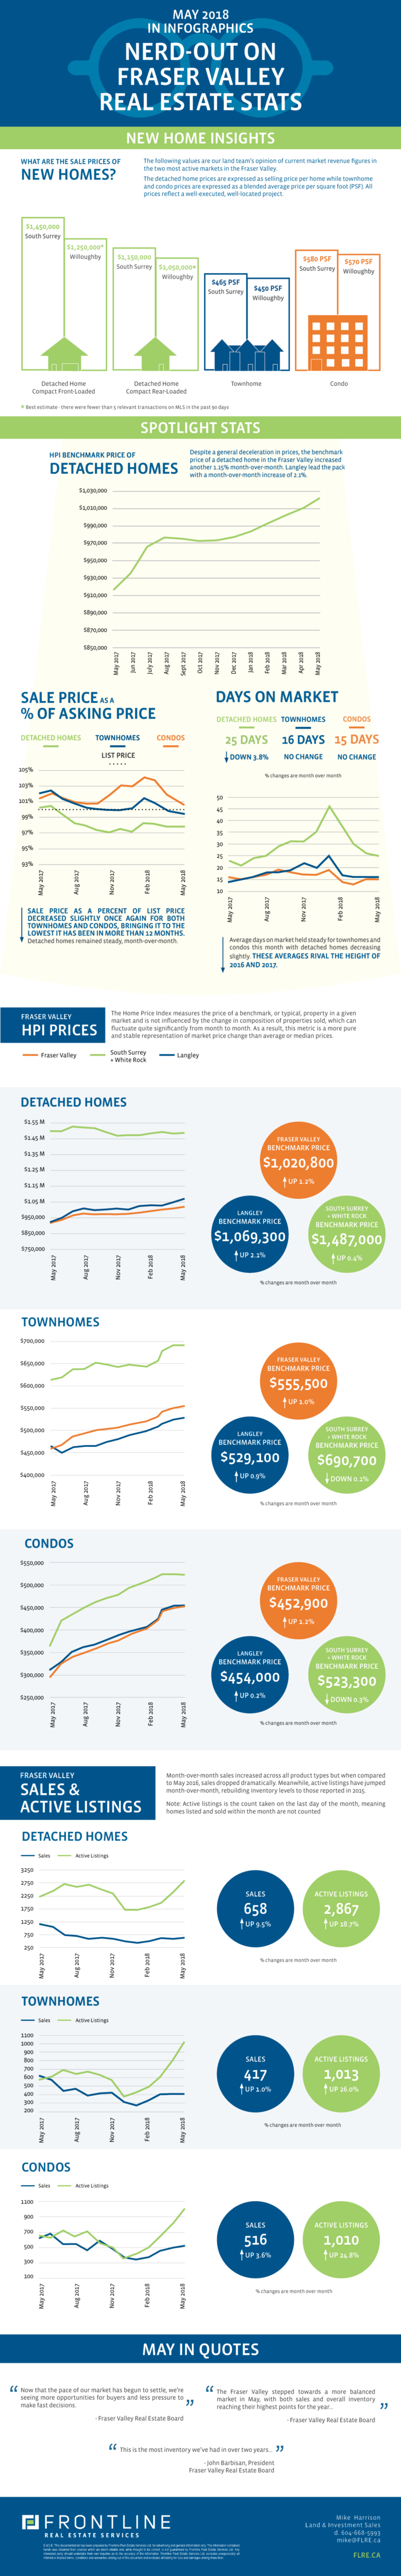
Year-over-year, sales fell 15% for condos, 33% for townhomes and 45% for detached homes but long-term context is important. With record sales reported in 2015 to 2017 the shorter-term comparison shows a dramatic drop. The 1,681 sales reported for May 2018, across all residential home types, is 97% of the 10-year average.
Demand is showing signs of stabilizing with average days on market holding relatively constant across all product types. Sale price as a percent of list price decreased slightly for townhouses and condos but held perfectly flat for detached homes.
Despite moderated activity and increased inventory, the benchmark price of condos, townhomes and detached homes all increased again month-over-month. Condos were up 1.2%, townhomes were up 1.0% and detached homes were up 1.15%. It’s not the 4% increases we saw earlier this year but prices are still strong in most regions of the Fraser Valley. South Surrey/White Rock appears to be the outlier reporting mild month-over-month decreases in benchmark prices for townhomes and condos.
Check out our curated summary of the Fraser Valley Real Estate Board’s May 2018 stats in infographics below.
View the Fraser Valley Real Estate Board’s entire stats package for May 2018 here.
This representation is based in whole or in part on data generated by the Fraser Valley Real Estate Board which assumes no responsibility for its accuracy.
