Infographic: Greater Vancouver Residential Real Estate December 2023
Metro Vancouver’s housing market in 2023 had balanced conditions despite the highest borrowing costs in over a decade. This highlights the market’s resilience, the impact of borrowing costs on sales and prices, and the dynamics of property listings and inventory in Metro Vancouver.
These residential market statistics from the Real Estate Board of Greater Vancouver provide insight into the current state of the residential home market, including home values, which directly impact the development land market. Contact us today if you would like to learn what your property is worth on the development land market.
KEY TAKEAWAYS FROM DECEMBER 2023 GREATER VANCOUVER RESIDENTIAL MARKET
- The Real Estate Board of Greater Vancouver (REBGV) had forecasted modest price increases for 2023, which materialized against predictions of price declines by other forecasters.
- Despite the challenges of high borrowing costs, Metro Vancouver’s housing market showed resilience with a 5% increase in home prices across all market segments.
- This indicates that even in the face of elevated borrowing costs Metro Vancouver remains an attractive and desirable destination for buyers.
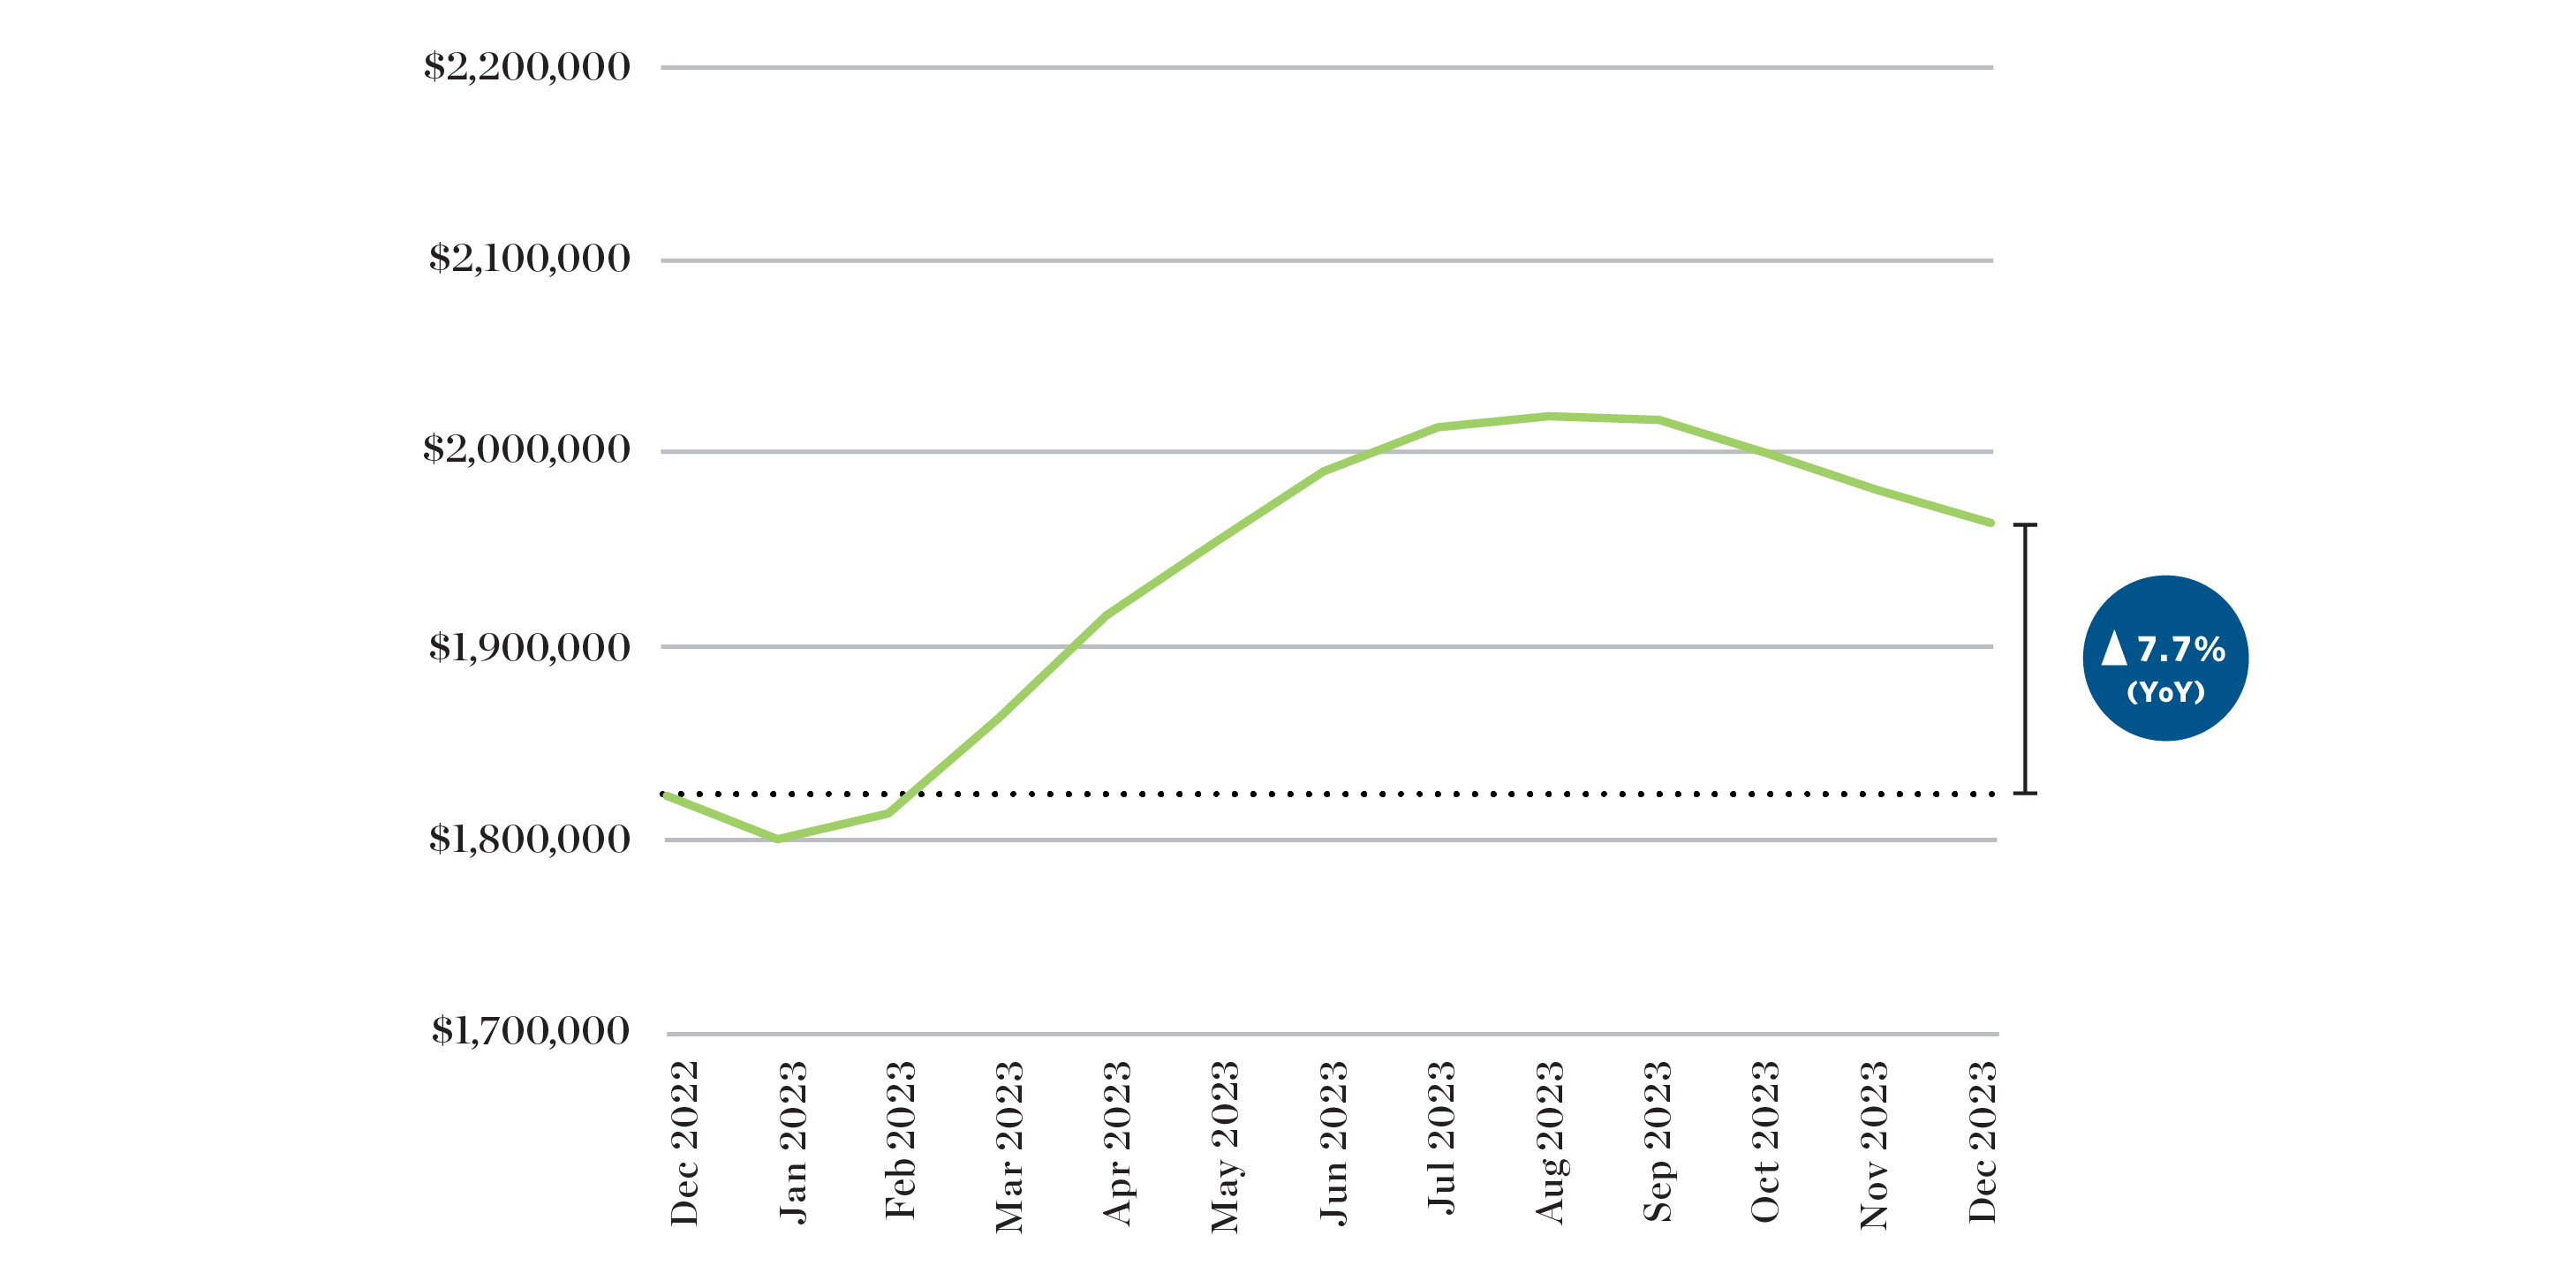
HPI Benchmark Price of Detached Homes
In December 2023, the sales of detached homes reached 376, representing a 1.3% increase from December 2022. The benchmark price for a detached home in Metro Vancouver was $1,964,400, showing a 7.7% increase from December 2022 but a 0.9% decrease compared to November 2023.
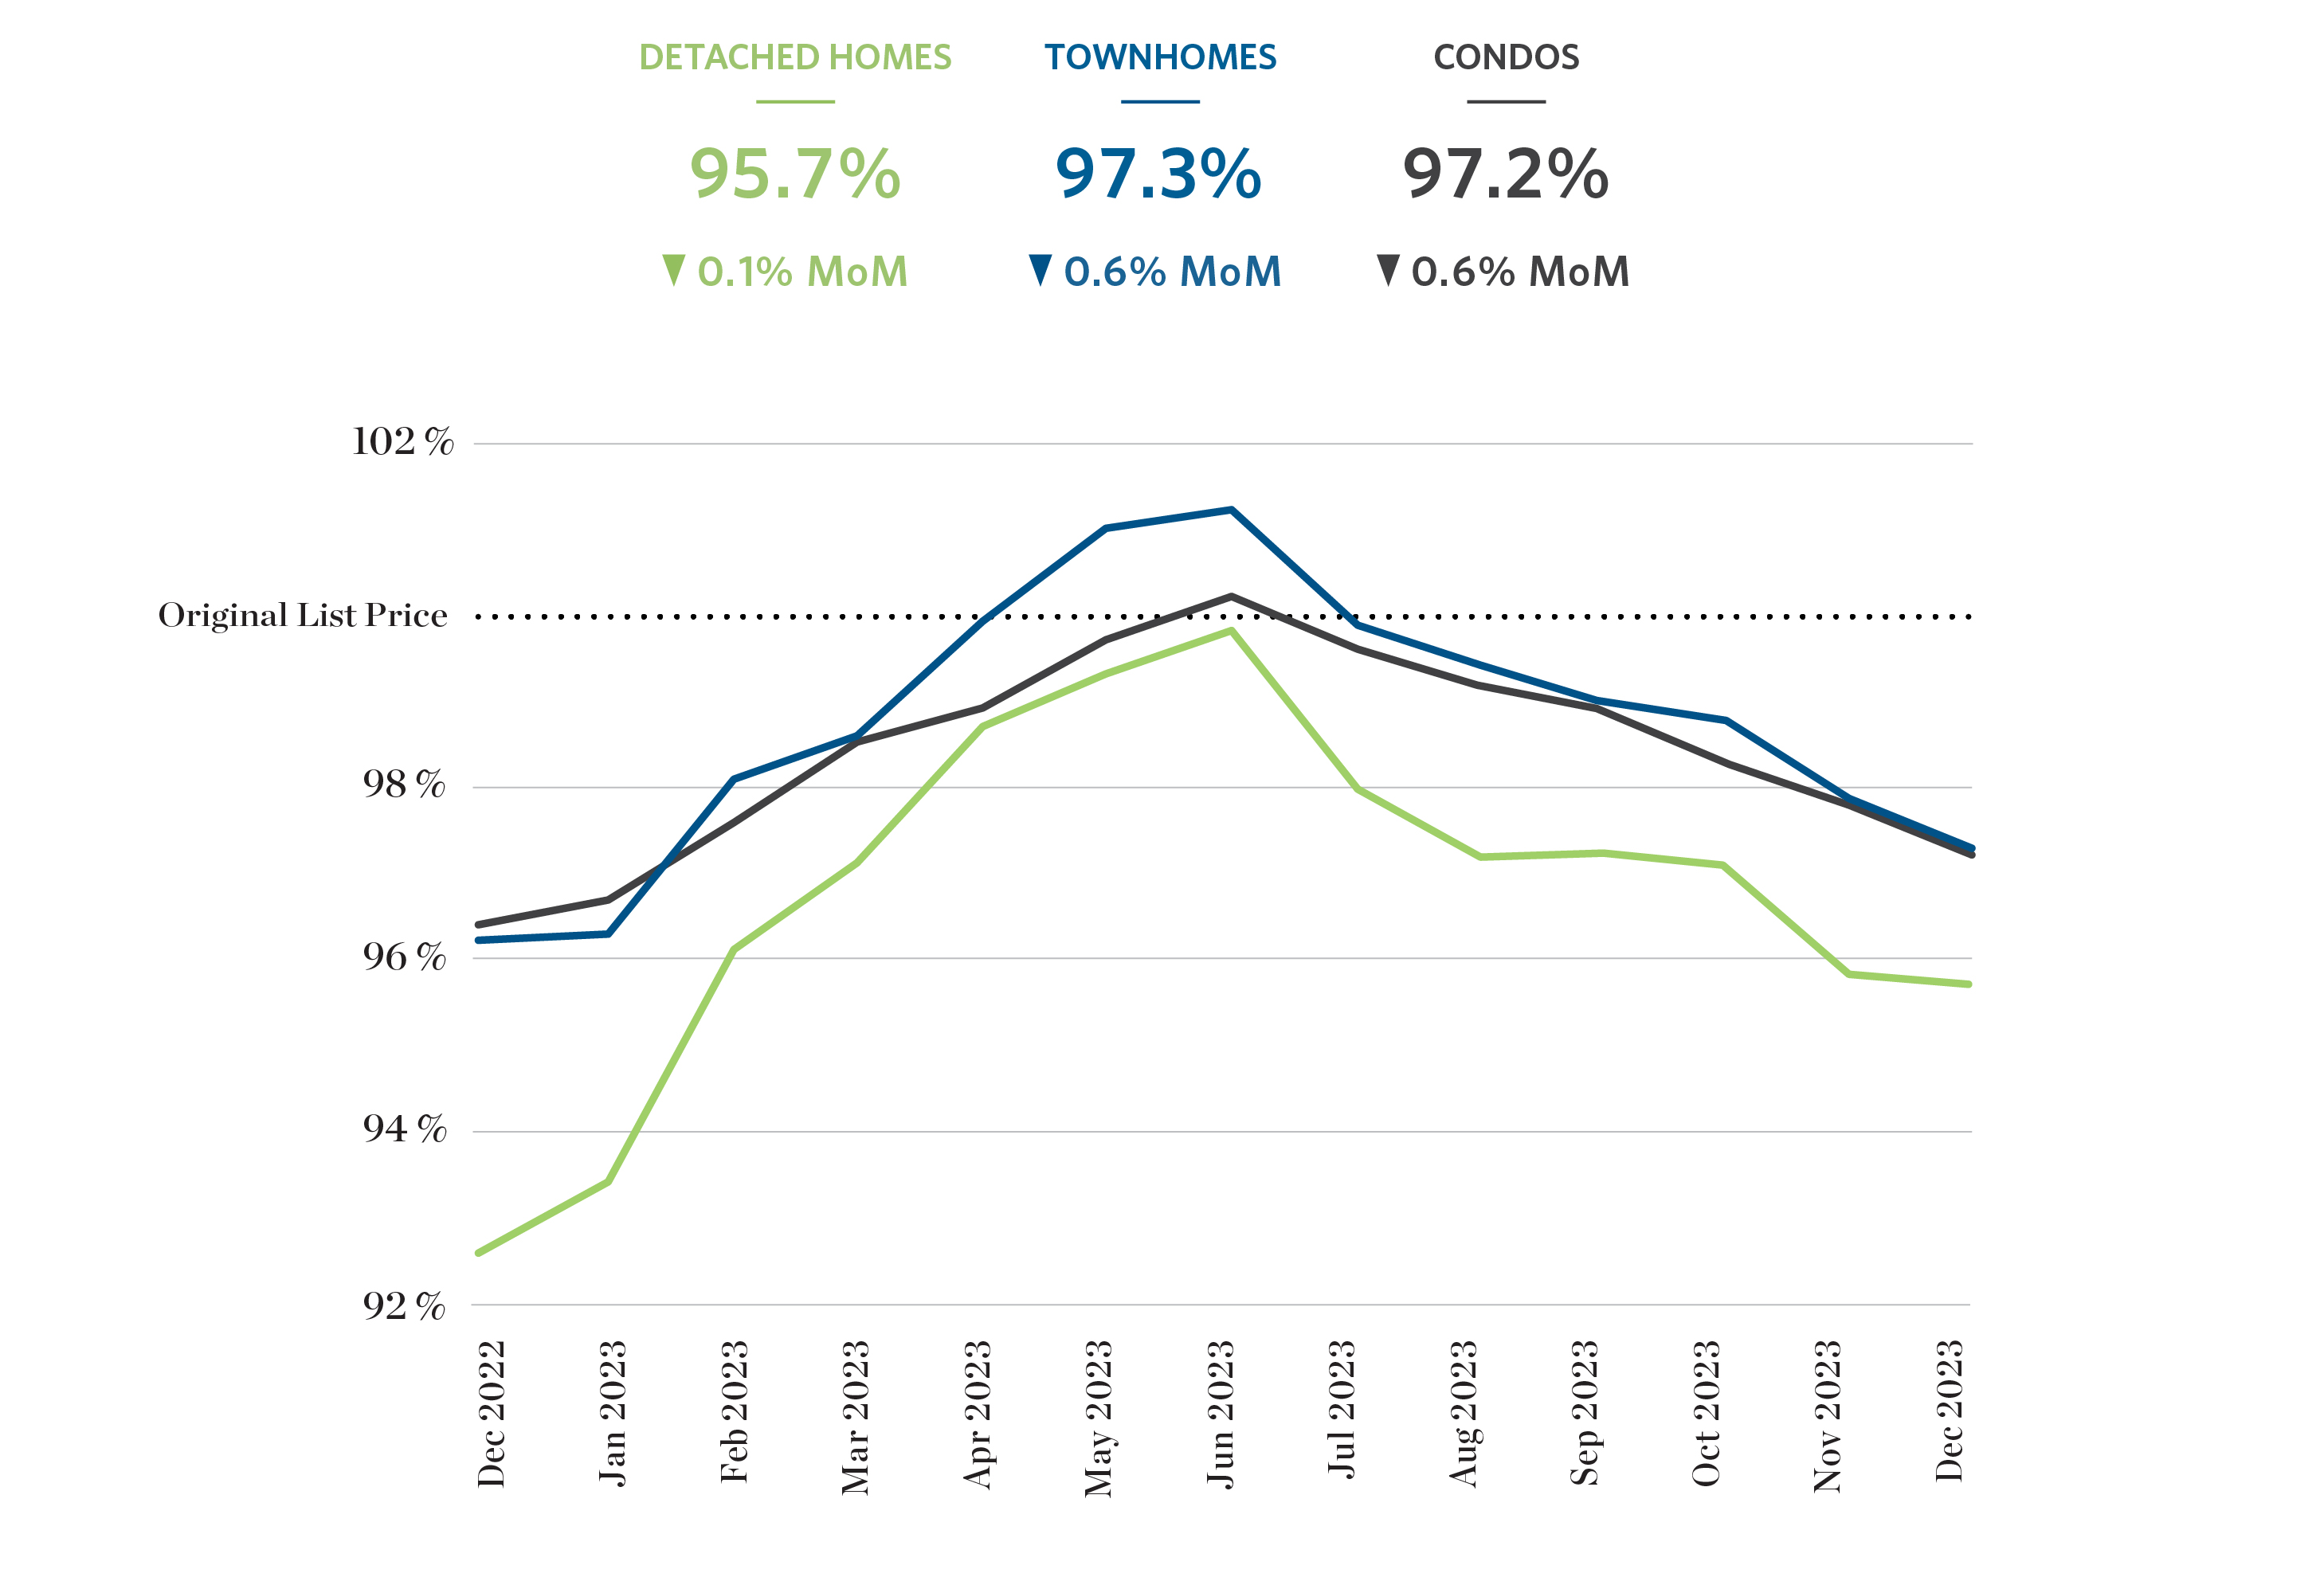
Sale Price As a Percent of Original List Price
The average sale price as a percentage of the original list price remained stable in December 2023. The most notable change was a decrease of -0.6% for both townhomes and condos compared to November, while detached homes experienced a slight decrease of -0.1%.
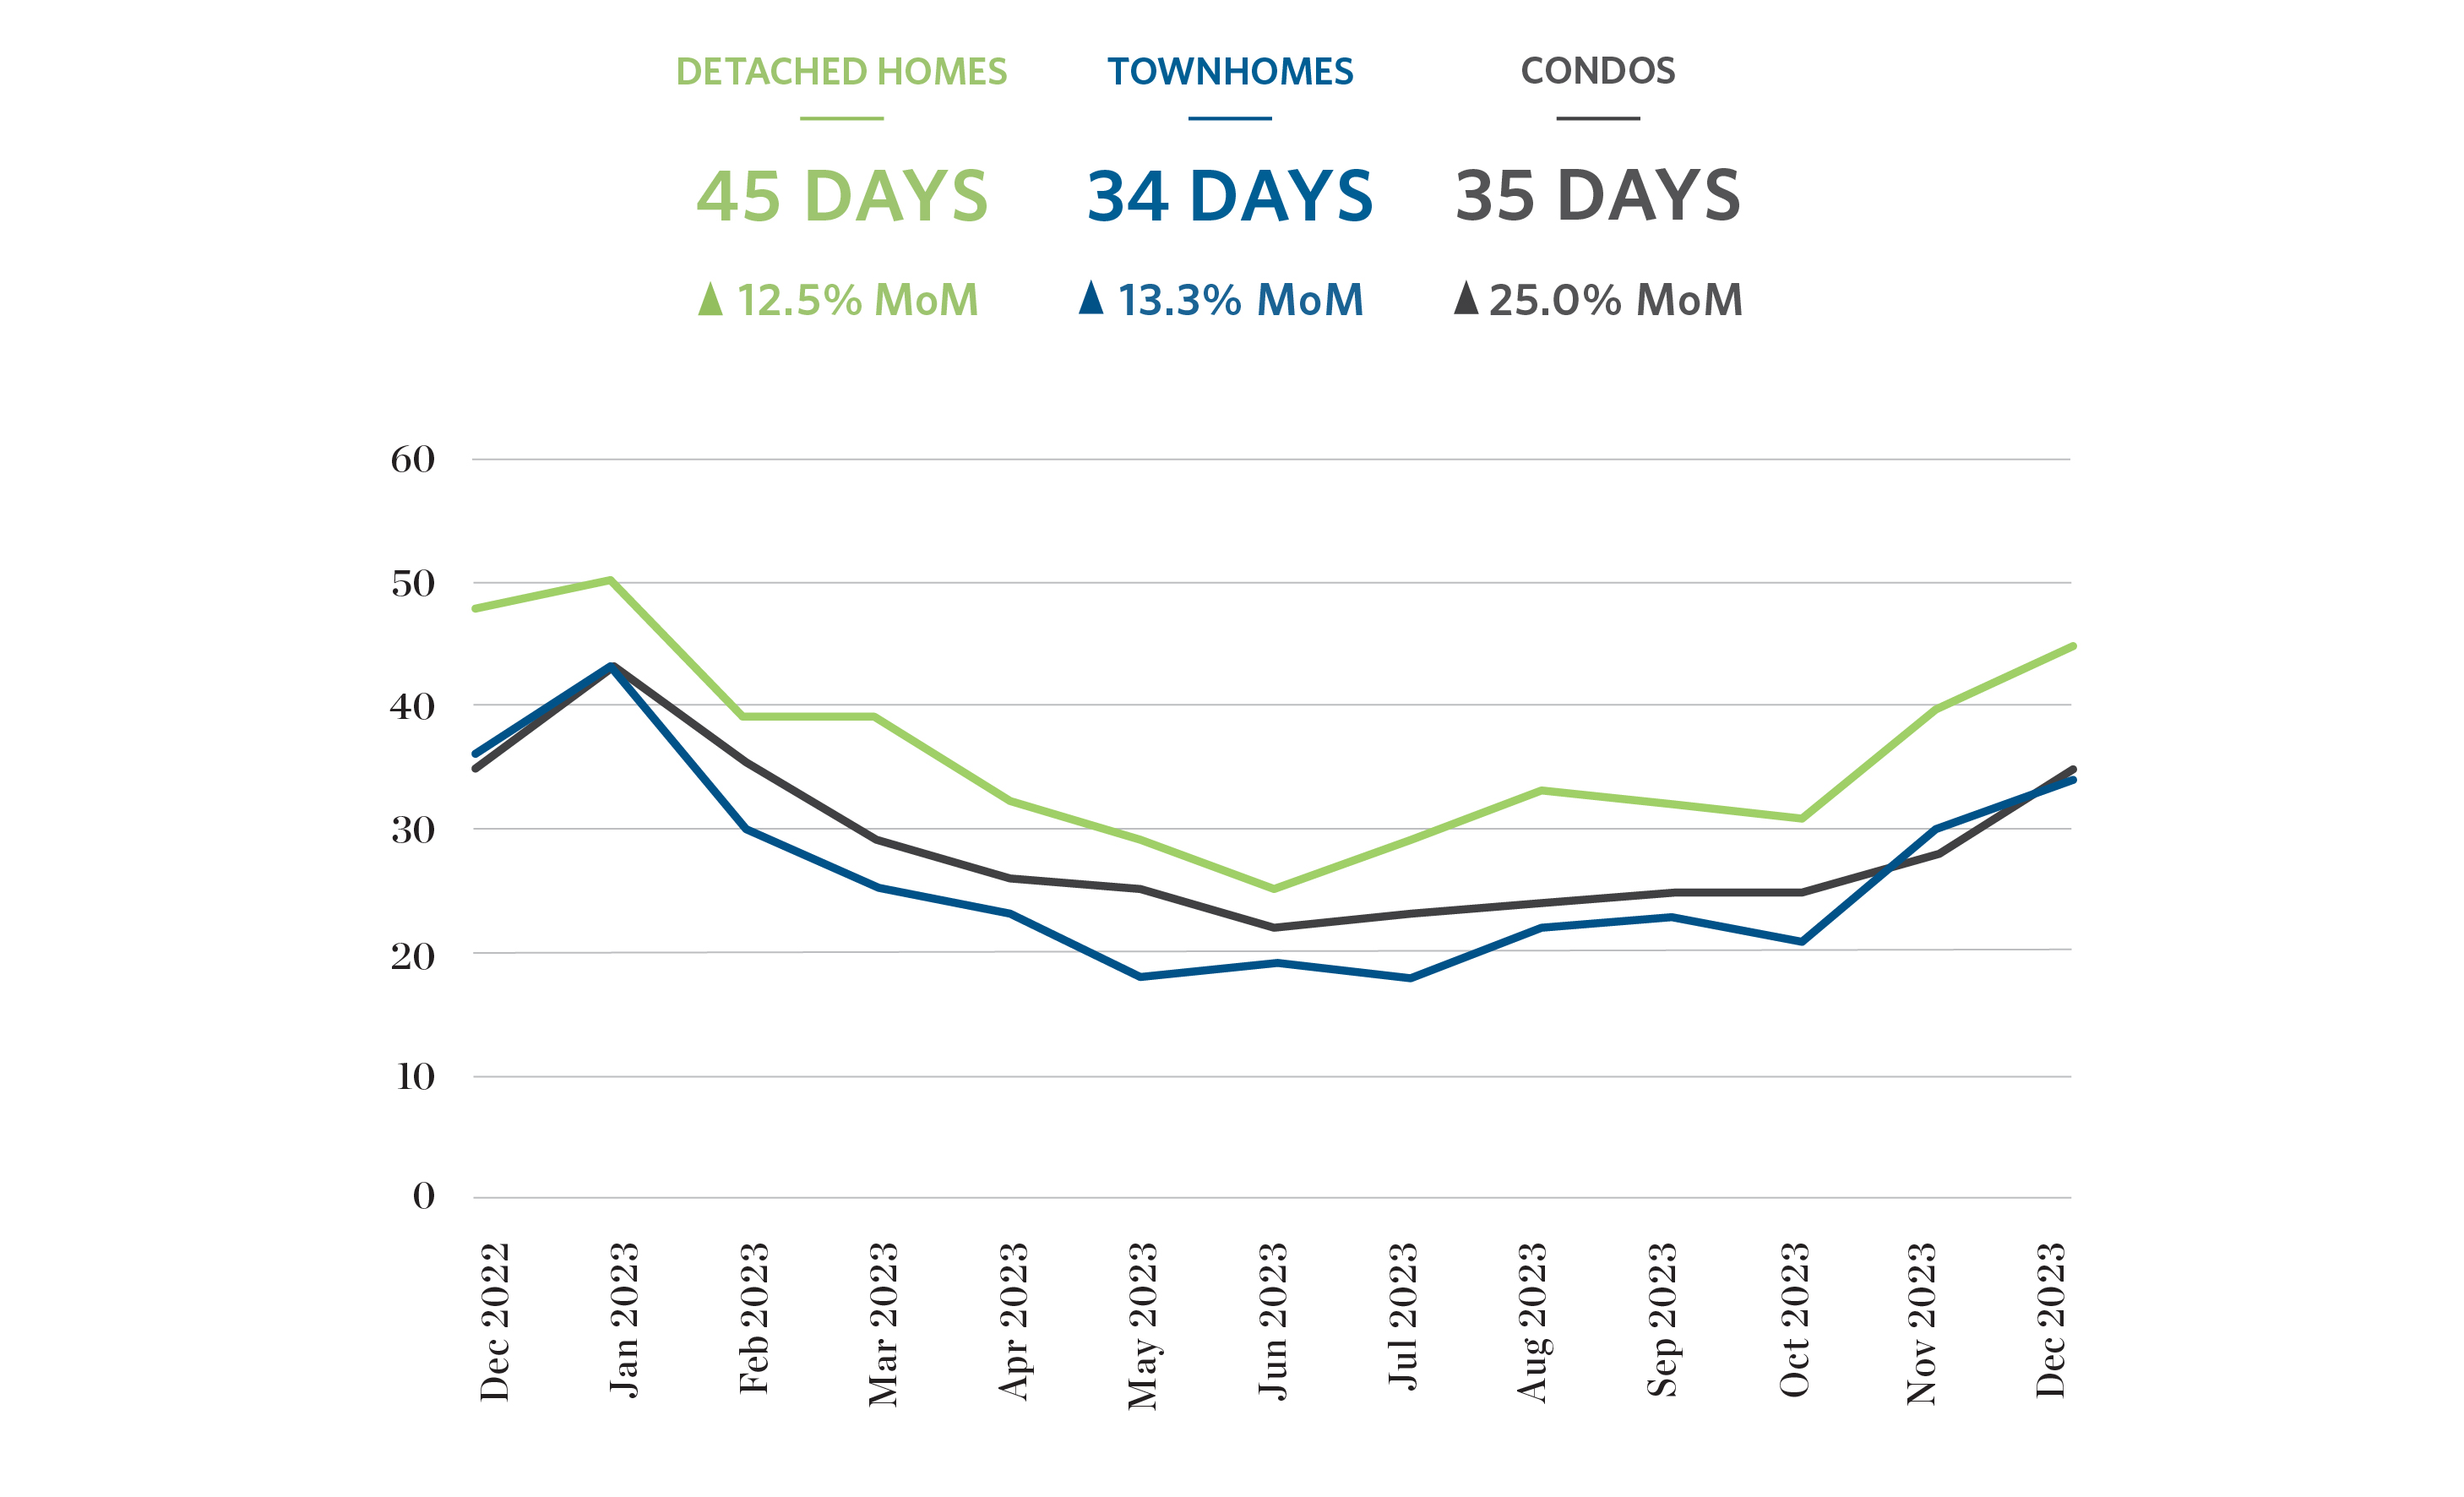
Days on Market
The average number of days homes remained on the market increased across all property types in December 2023. Condos saw the most significant change, with a 25% increase, resulting in an average of 35 days on the market. Townhomes lasted an average of 34 days, while detached homes remained on the market for an average of 45 days.
Featured Homes
Looking for a new home? Check out these featured new homes courtesy of our affiliate company, Breakside Real Estate Group.

GREATER VANCOUVER RESIDENTIAL REAL ESTATE: december 2023 statistics in infographics
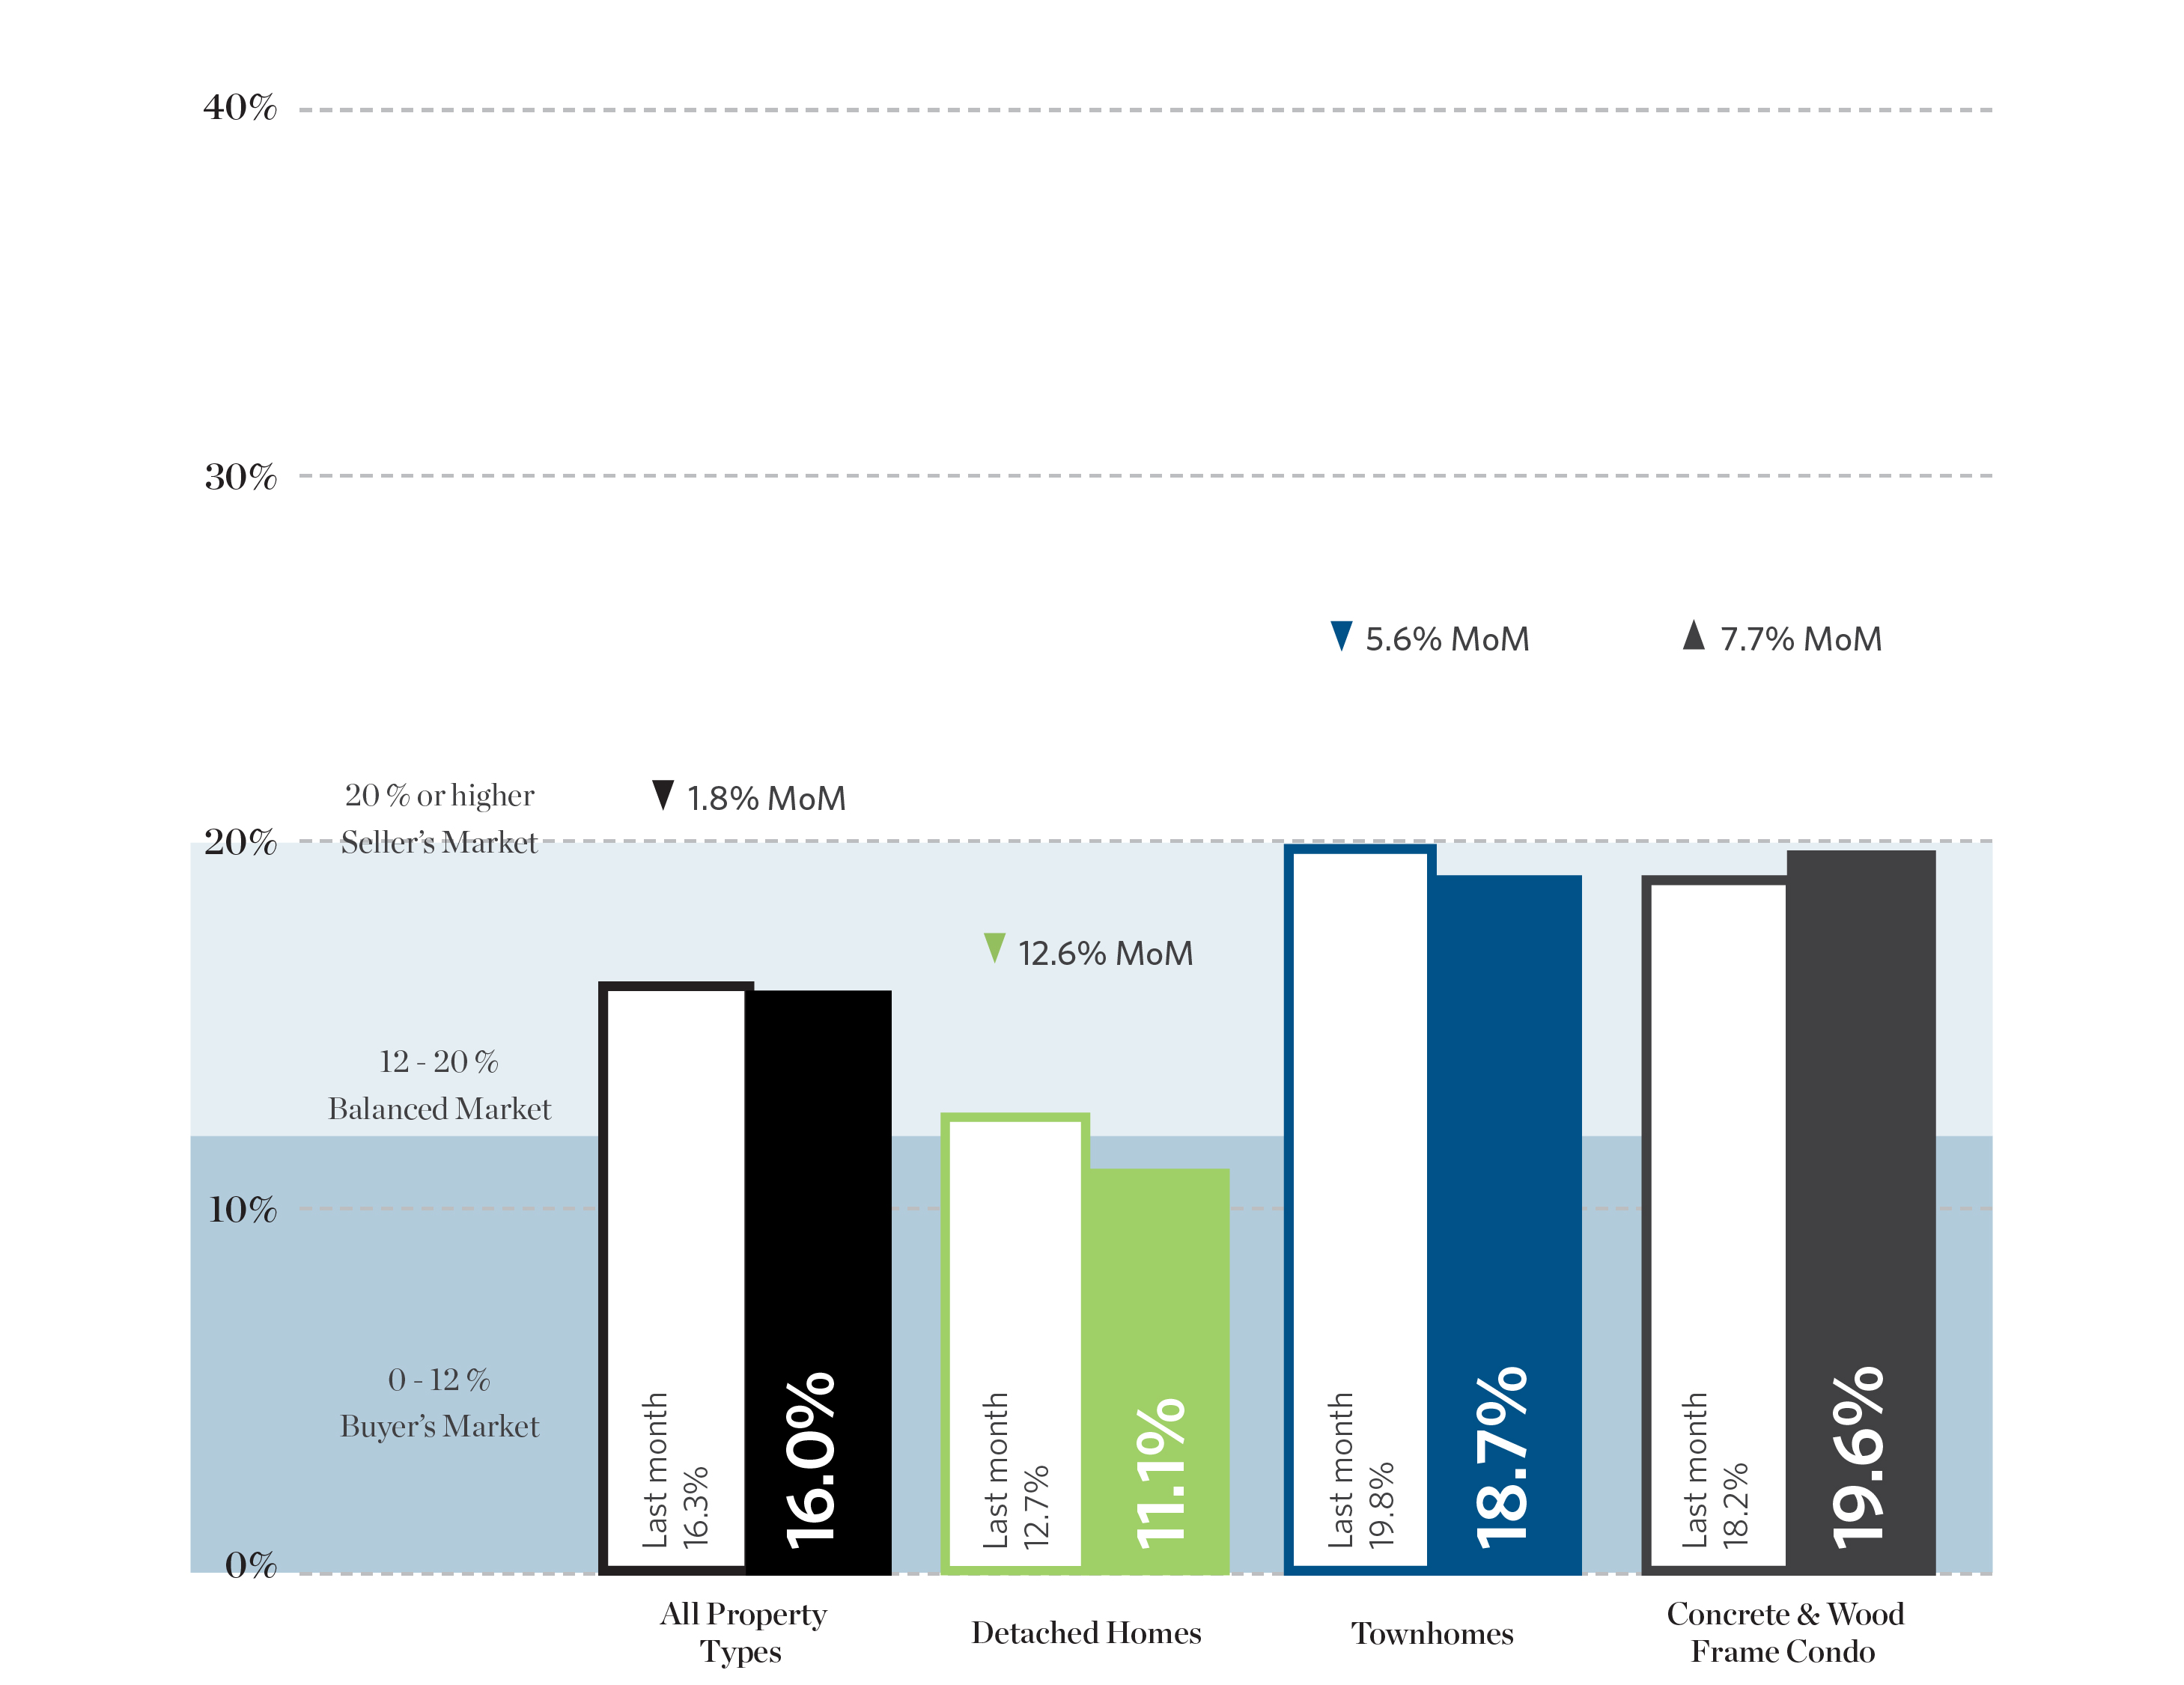
Sales To Active Listings Ratio
In December 2023, Metro Vancouver’s housing market saw a sales-to-active listing ratio of 16%. This ratio indicates a balanced market, with neither buyers nor sellers having a significant advantage. When broken down by property type, detached homes had a ratio of 11.1%, suggesting a market favoring buyers, while attached homes (18.7%) and apartments (19.6%) remained in seller’s market territory.
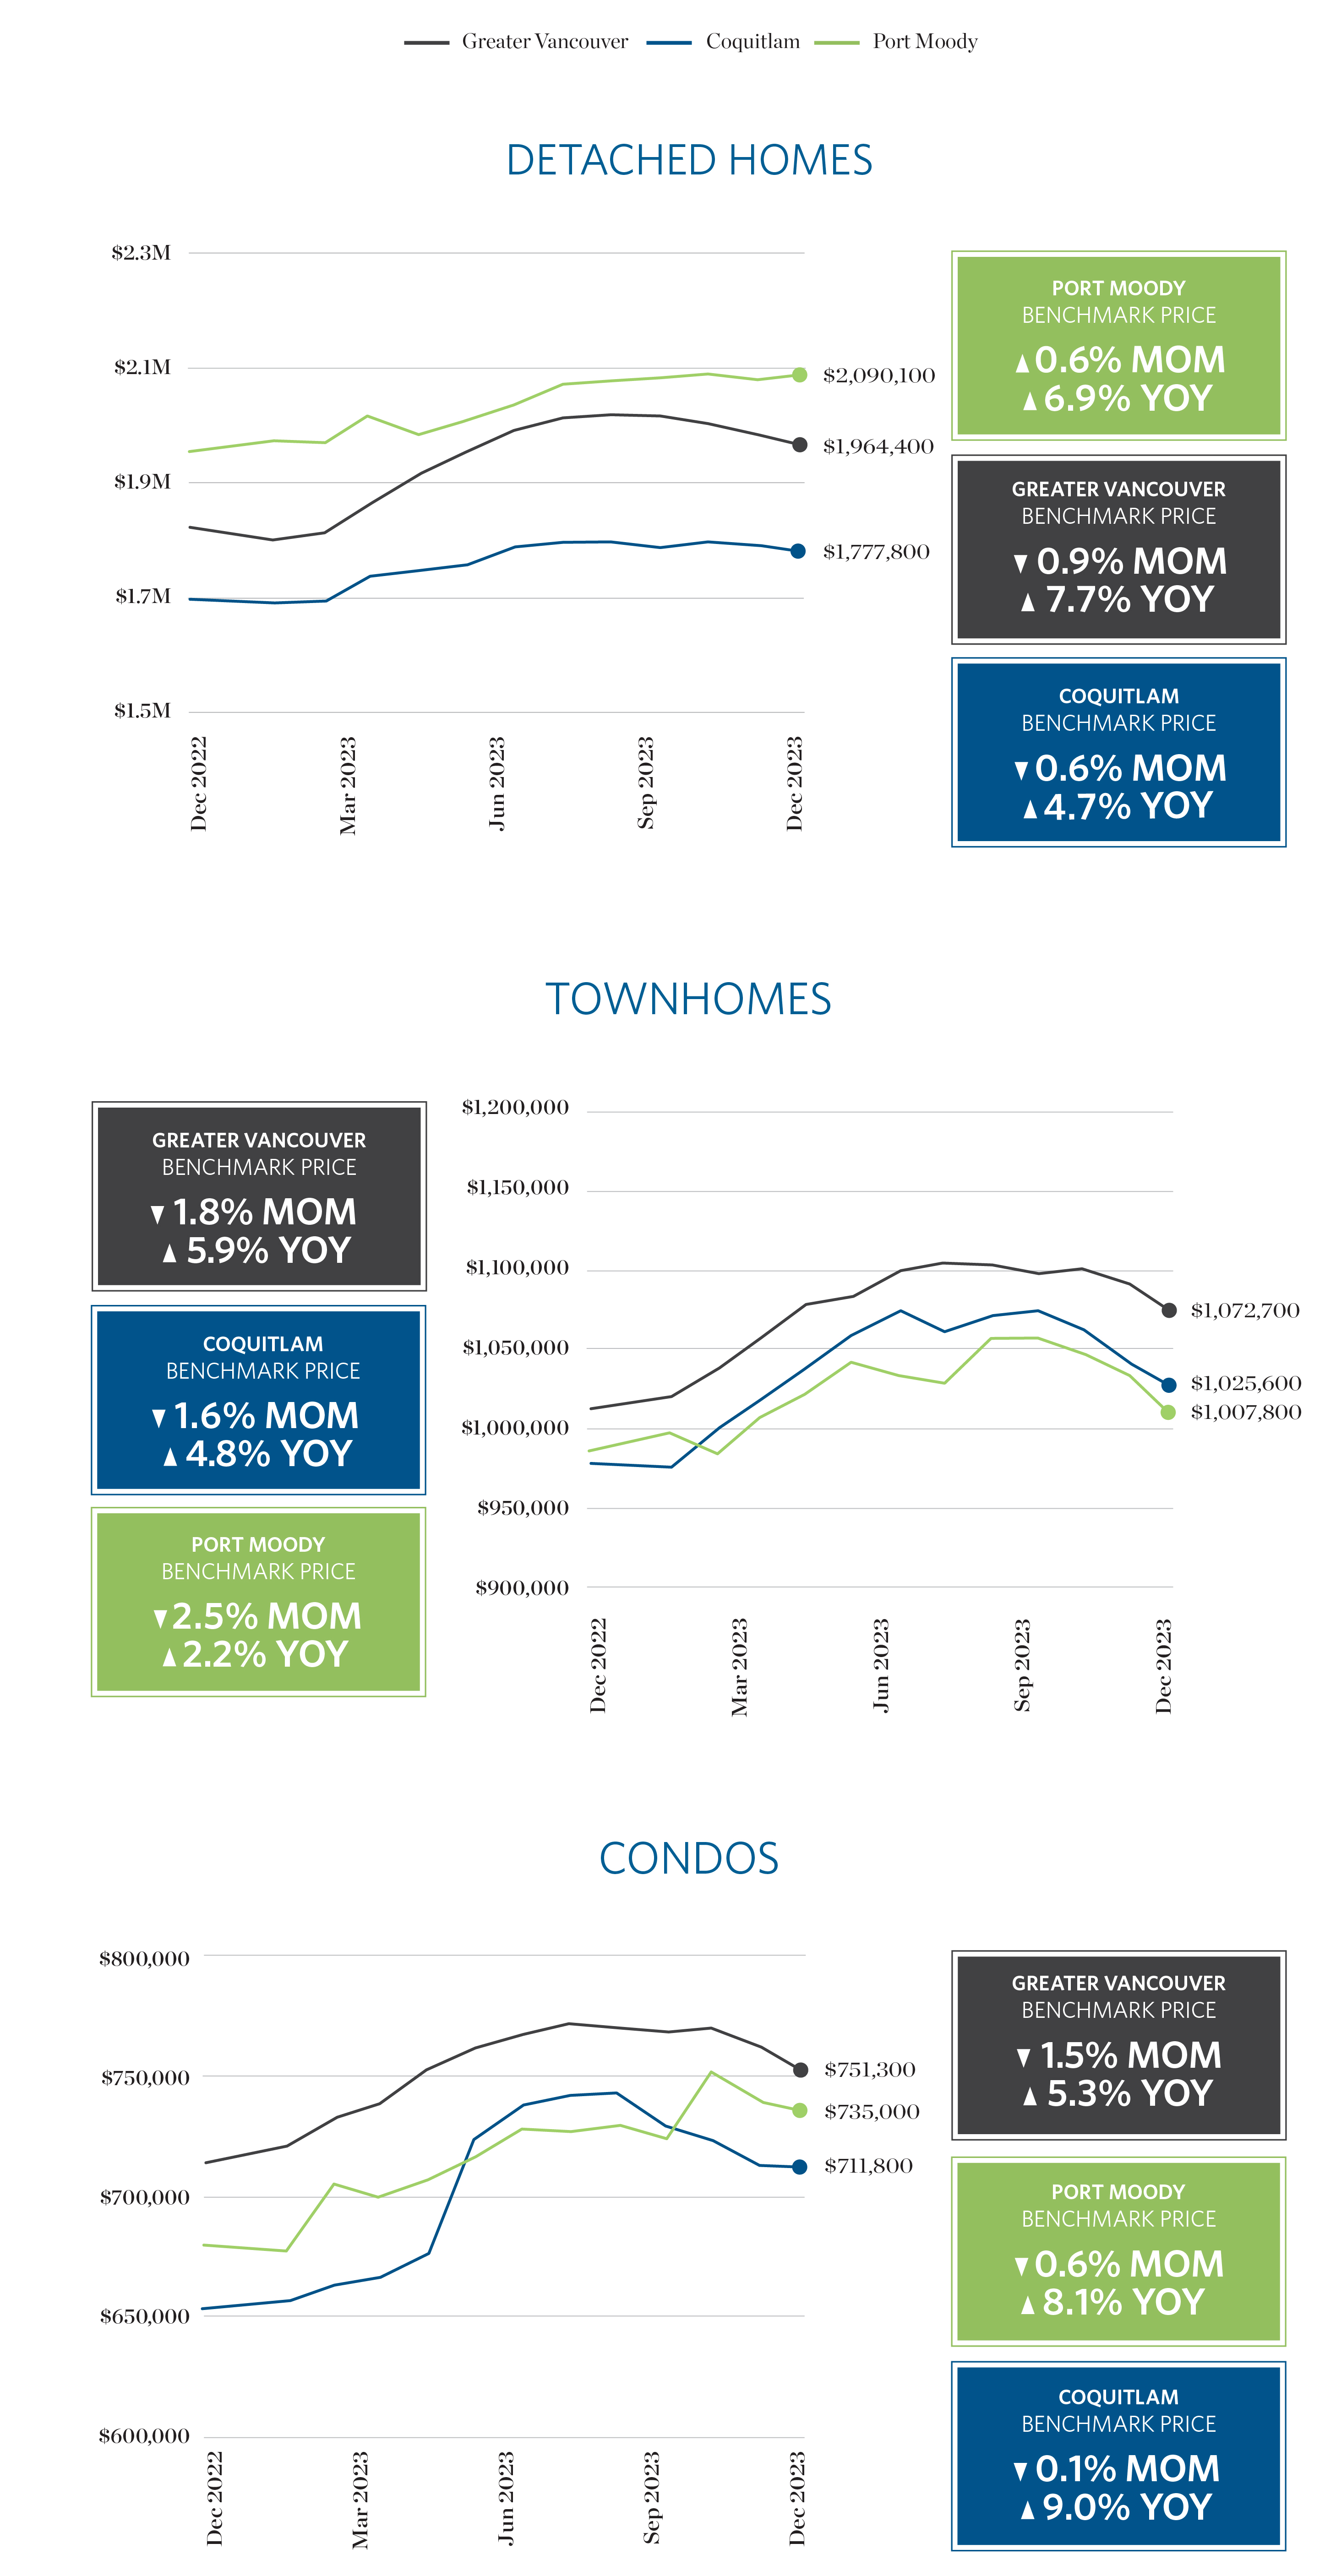
HPI Benchmark Prices
The Home Price Index (HPI) measures the price of a benchmark, or typical, property in a given market and is not influenced by the change in composition of properties sold, which can fluctuate quite significantly from month to month. As a result, this metric is a more pure and stable representation of market price change than average or median prices.
Metro Vancouver’s housing market saw varying trends in HPI benchmark prices across different property types. Detached homes had a benchmark price of $1,964,400, showing a 7.7% increase from December 2022 but a 0.9% decrease compared to November 2023. Apartments had a benchmark price of $751,300, indicating a 5.3% increase from December 2022 but a 1.5% decrease compared to November 2023. Townhomes had a benchmark price of $1,072,700, reflecting a 5.9% increase from December 2022 but a 1.8% decrease compared to November 2023.
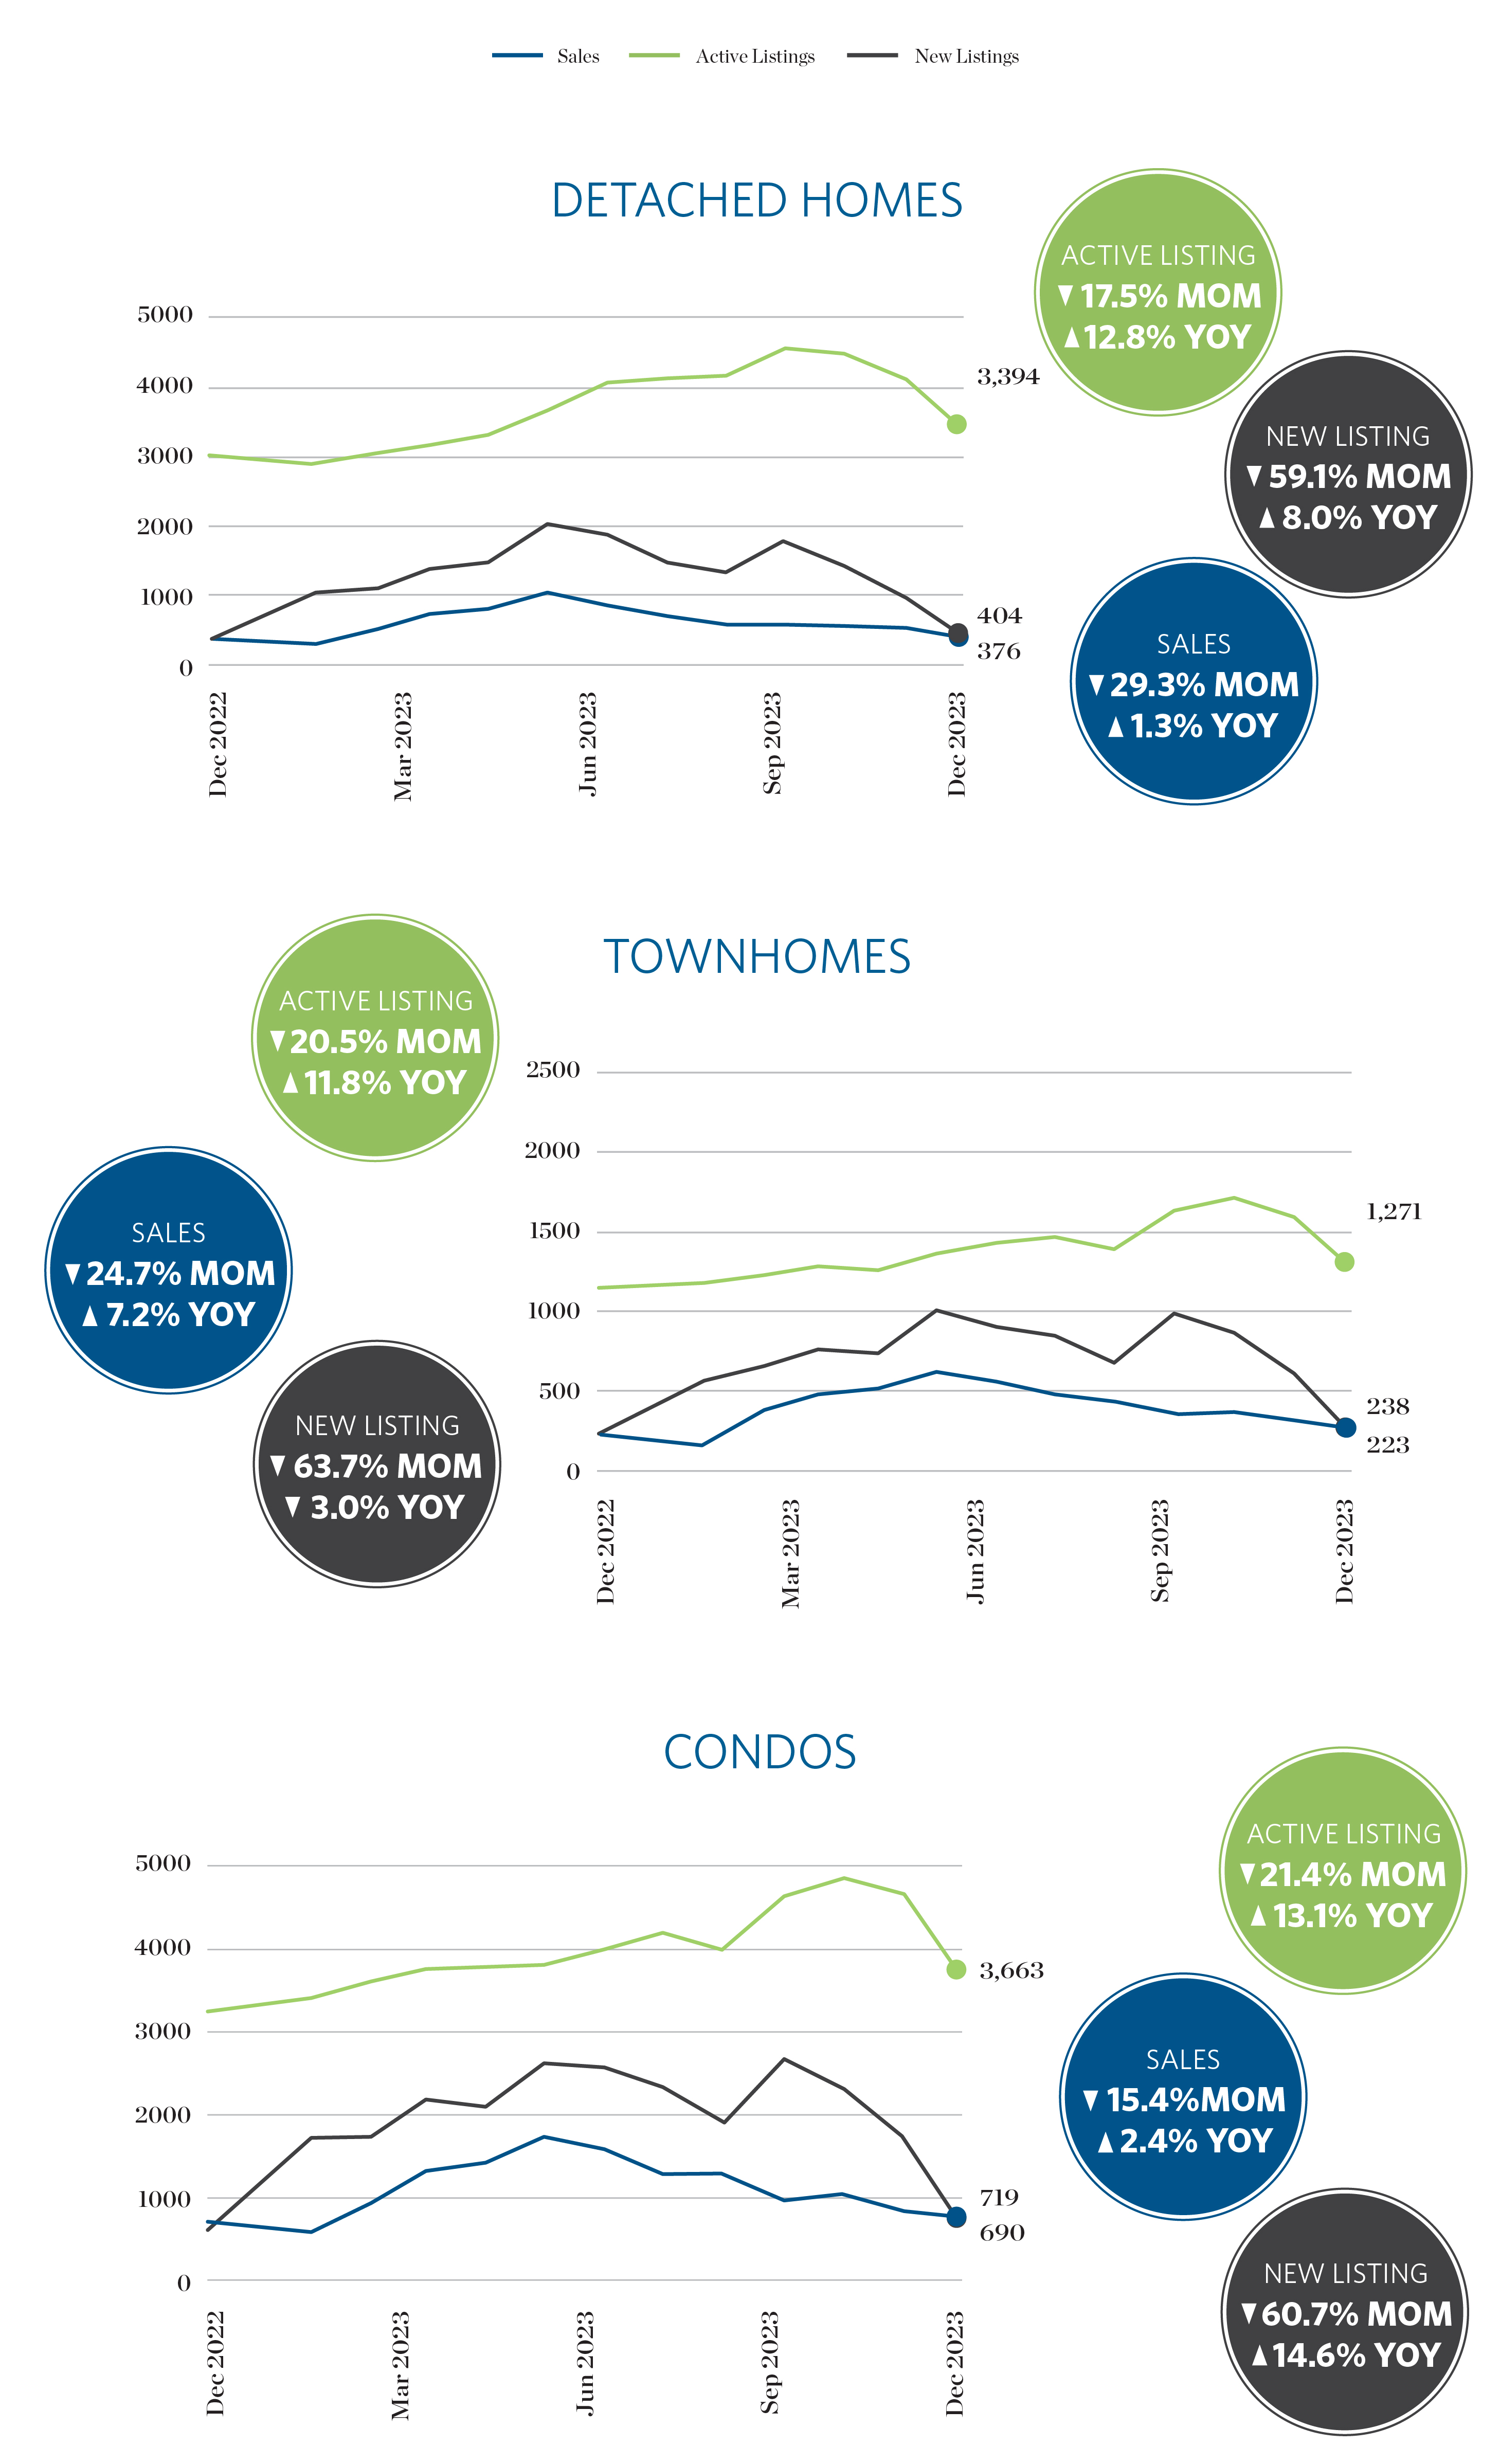
Sales • New Listings • Active Listings
In December 2023, Metro Vancouver’s housing market maintained a balanced overall sales-to-active listings ratio of 16%, signaling a stable balance between supply and demand. Additionally, new listings in Greater Vancouver for December 2023 experienced a notable increase of 9.9% compared to the same period in 2022. These figures collectively provide insights into the market’s evolving dynamics, offering valuable information for both buyers and sellers in the region.
Further Reading
View the Real Estate Board of Greater Vancouver’s entire stats package for December 2023 here.
Please note: areas covered by the Real Estate Board of Greater Vancouver include: Whistler, Sunshine Coast, Squamish, West Vancouver, North Vancouver, Vancouver, Burnaby, New Westminster, Richmond, Port Moody, Port Coquitlam, Coquitlam, Pitt Meadows, Maple Ridge, and South Delta.
Sources
Sources: Breakside Real Estate Group, Real Estate Board of Greater Vancouver
This representation is based in whole or in part on data generated by the Real Estate Board of Greater Vancouver which assumes no responsibility for its accuracy.
