Infographic: Greater Vancouver Residential Real Estate January 2024
In January 2024, Metro Vancouver’s real estate market displayed signs of renewed activity after a relatively quiet December. The month saw a notable surge in residential sales which was an indication of a strong rebound in buyer activity and confidence. The market also saw a rise in new listings, suggesting a growing supply of homes entering the market. Overall, these trends point to a dynamic market with increasing demand and a growing inventory of available homes in Metro Vancouver.
These residential market statistics from the Real Estate Board of Greater Vancouver provide insight into the current state of the residential home market, including home values, which directly impact the development land market. Contact us today if you would like to learn what your property is worth on the development land market.
KEY TAKEAWAYS FROM JANUARY 2024 GREATER VANCOUVER RESIDENTIAL MARKET
- Metro Vancouver’s housing market experienced a significant rebound in sales activity in January 2024, with a 38.5% increase compared to January 2023.
- The market saw a notable increase in new listings, up by 14.5% from January 2023, suggesting a growing supply of homes entering the market.
- This balance suggests that while there is growing supply, it is not yet at levels that could significantly impact market dynamics.
HPI Benchmark Price of Detached Homes
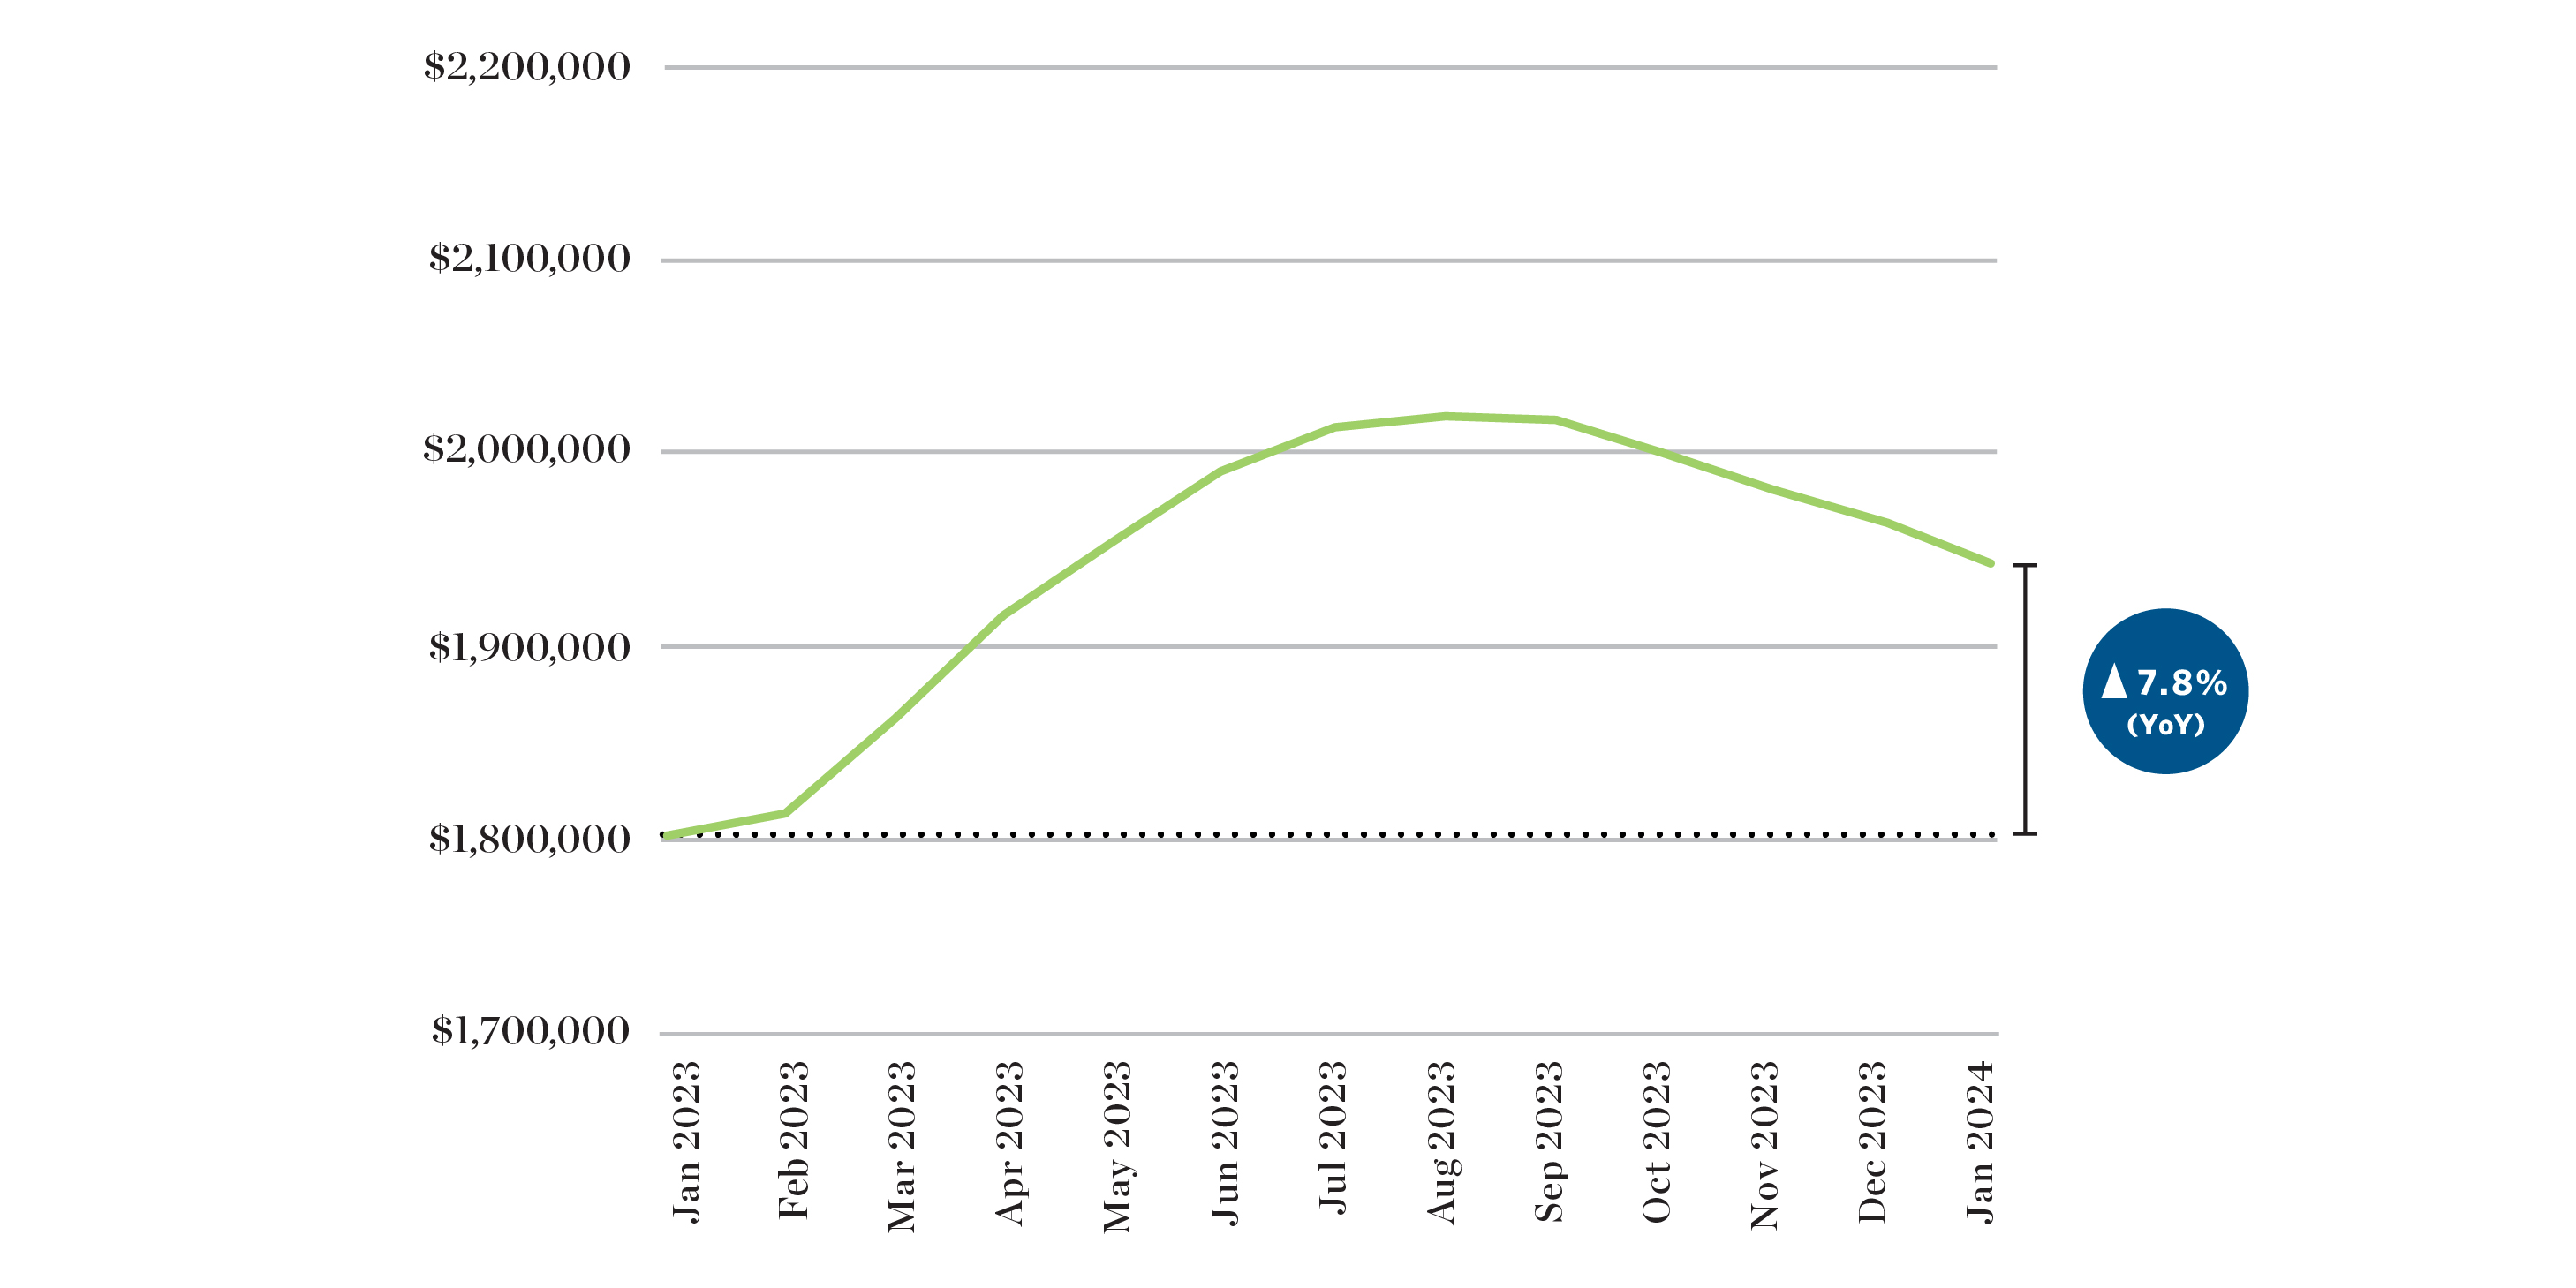
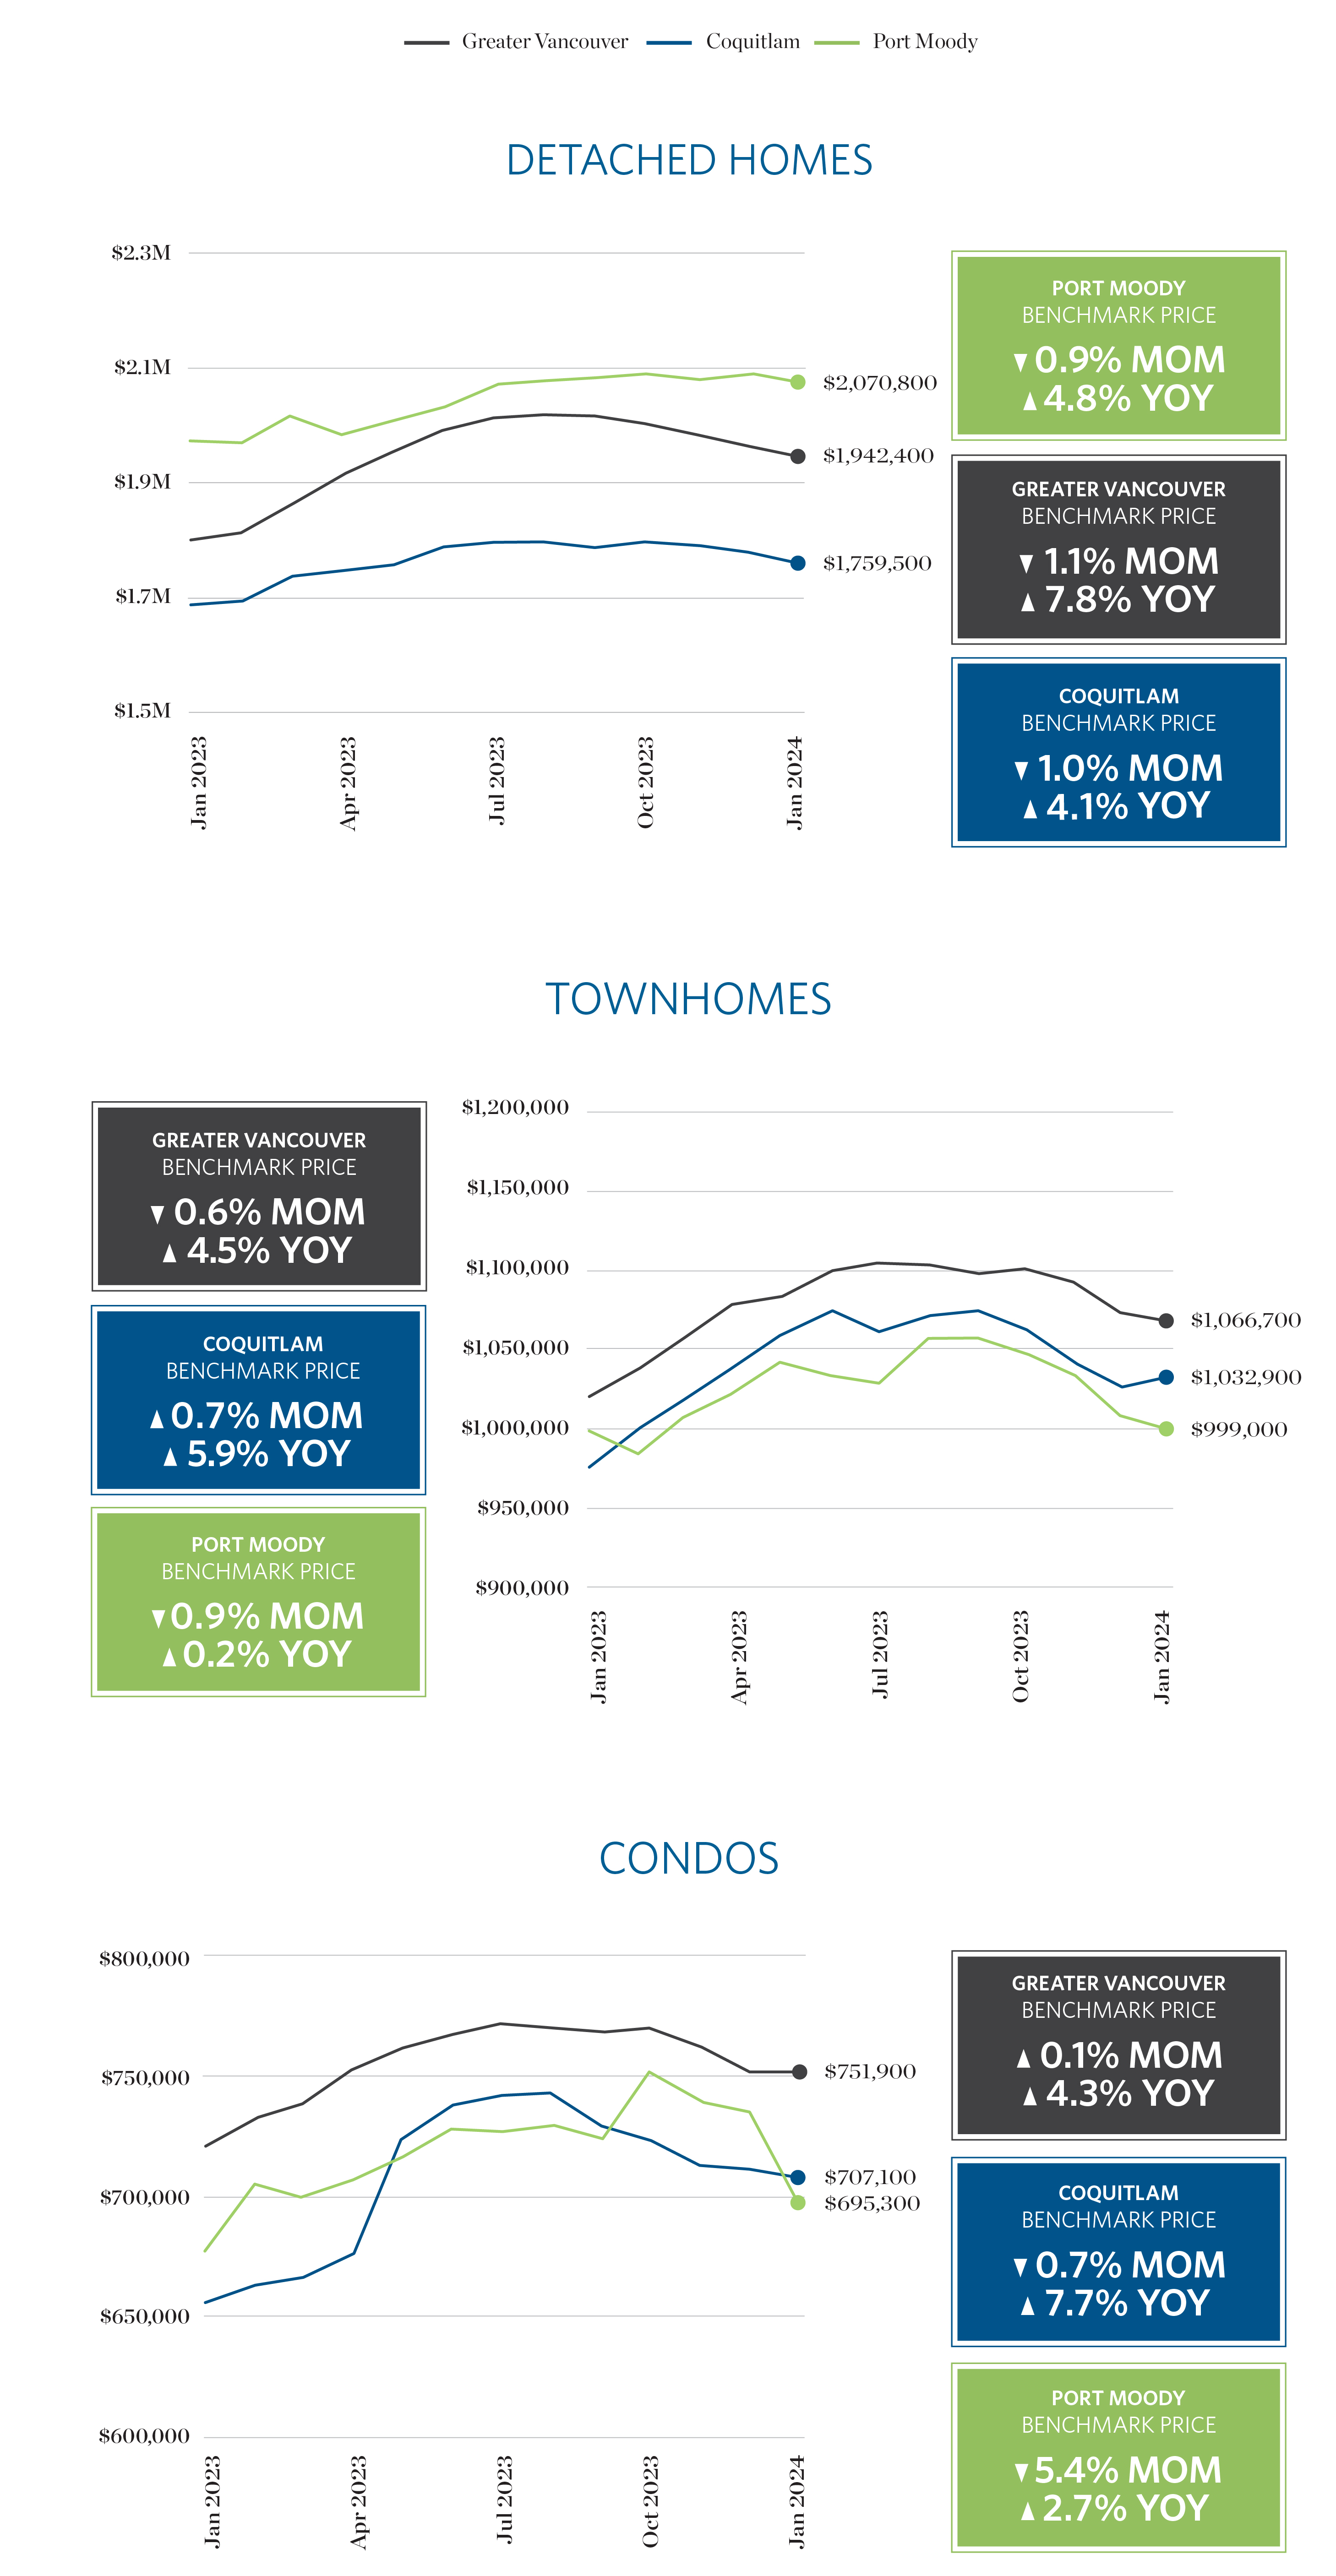
The benchmark price for detached homes in Metro Vancouver reached $1,942,400 in January 2024, marking a significant 7.8% increase from January 2023. However, there was a slight 1.1% decrease compared to December 2023. This indicates a robust demand for detached homes, leading to price appreciation over the year but a slight decline in the short term.
Sale Price As a Percent of Original List Price
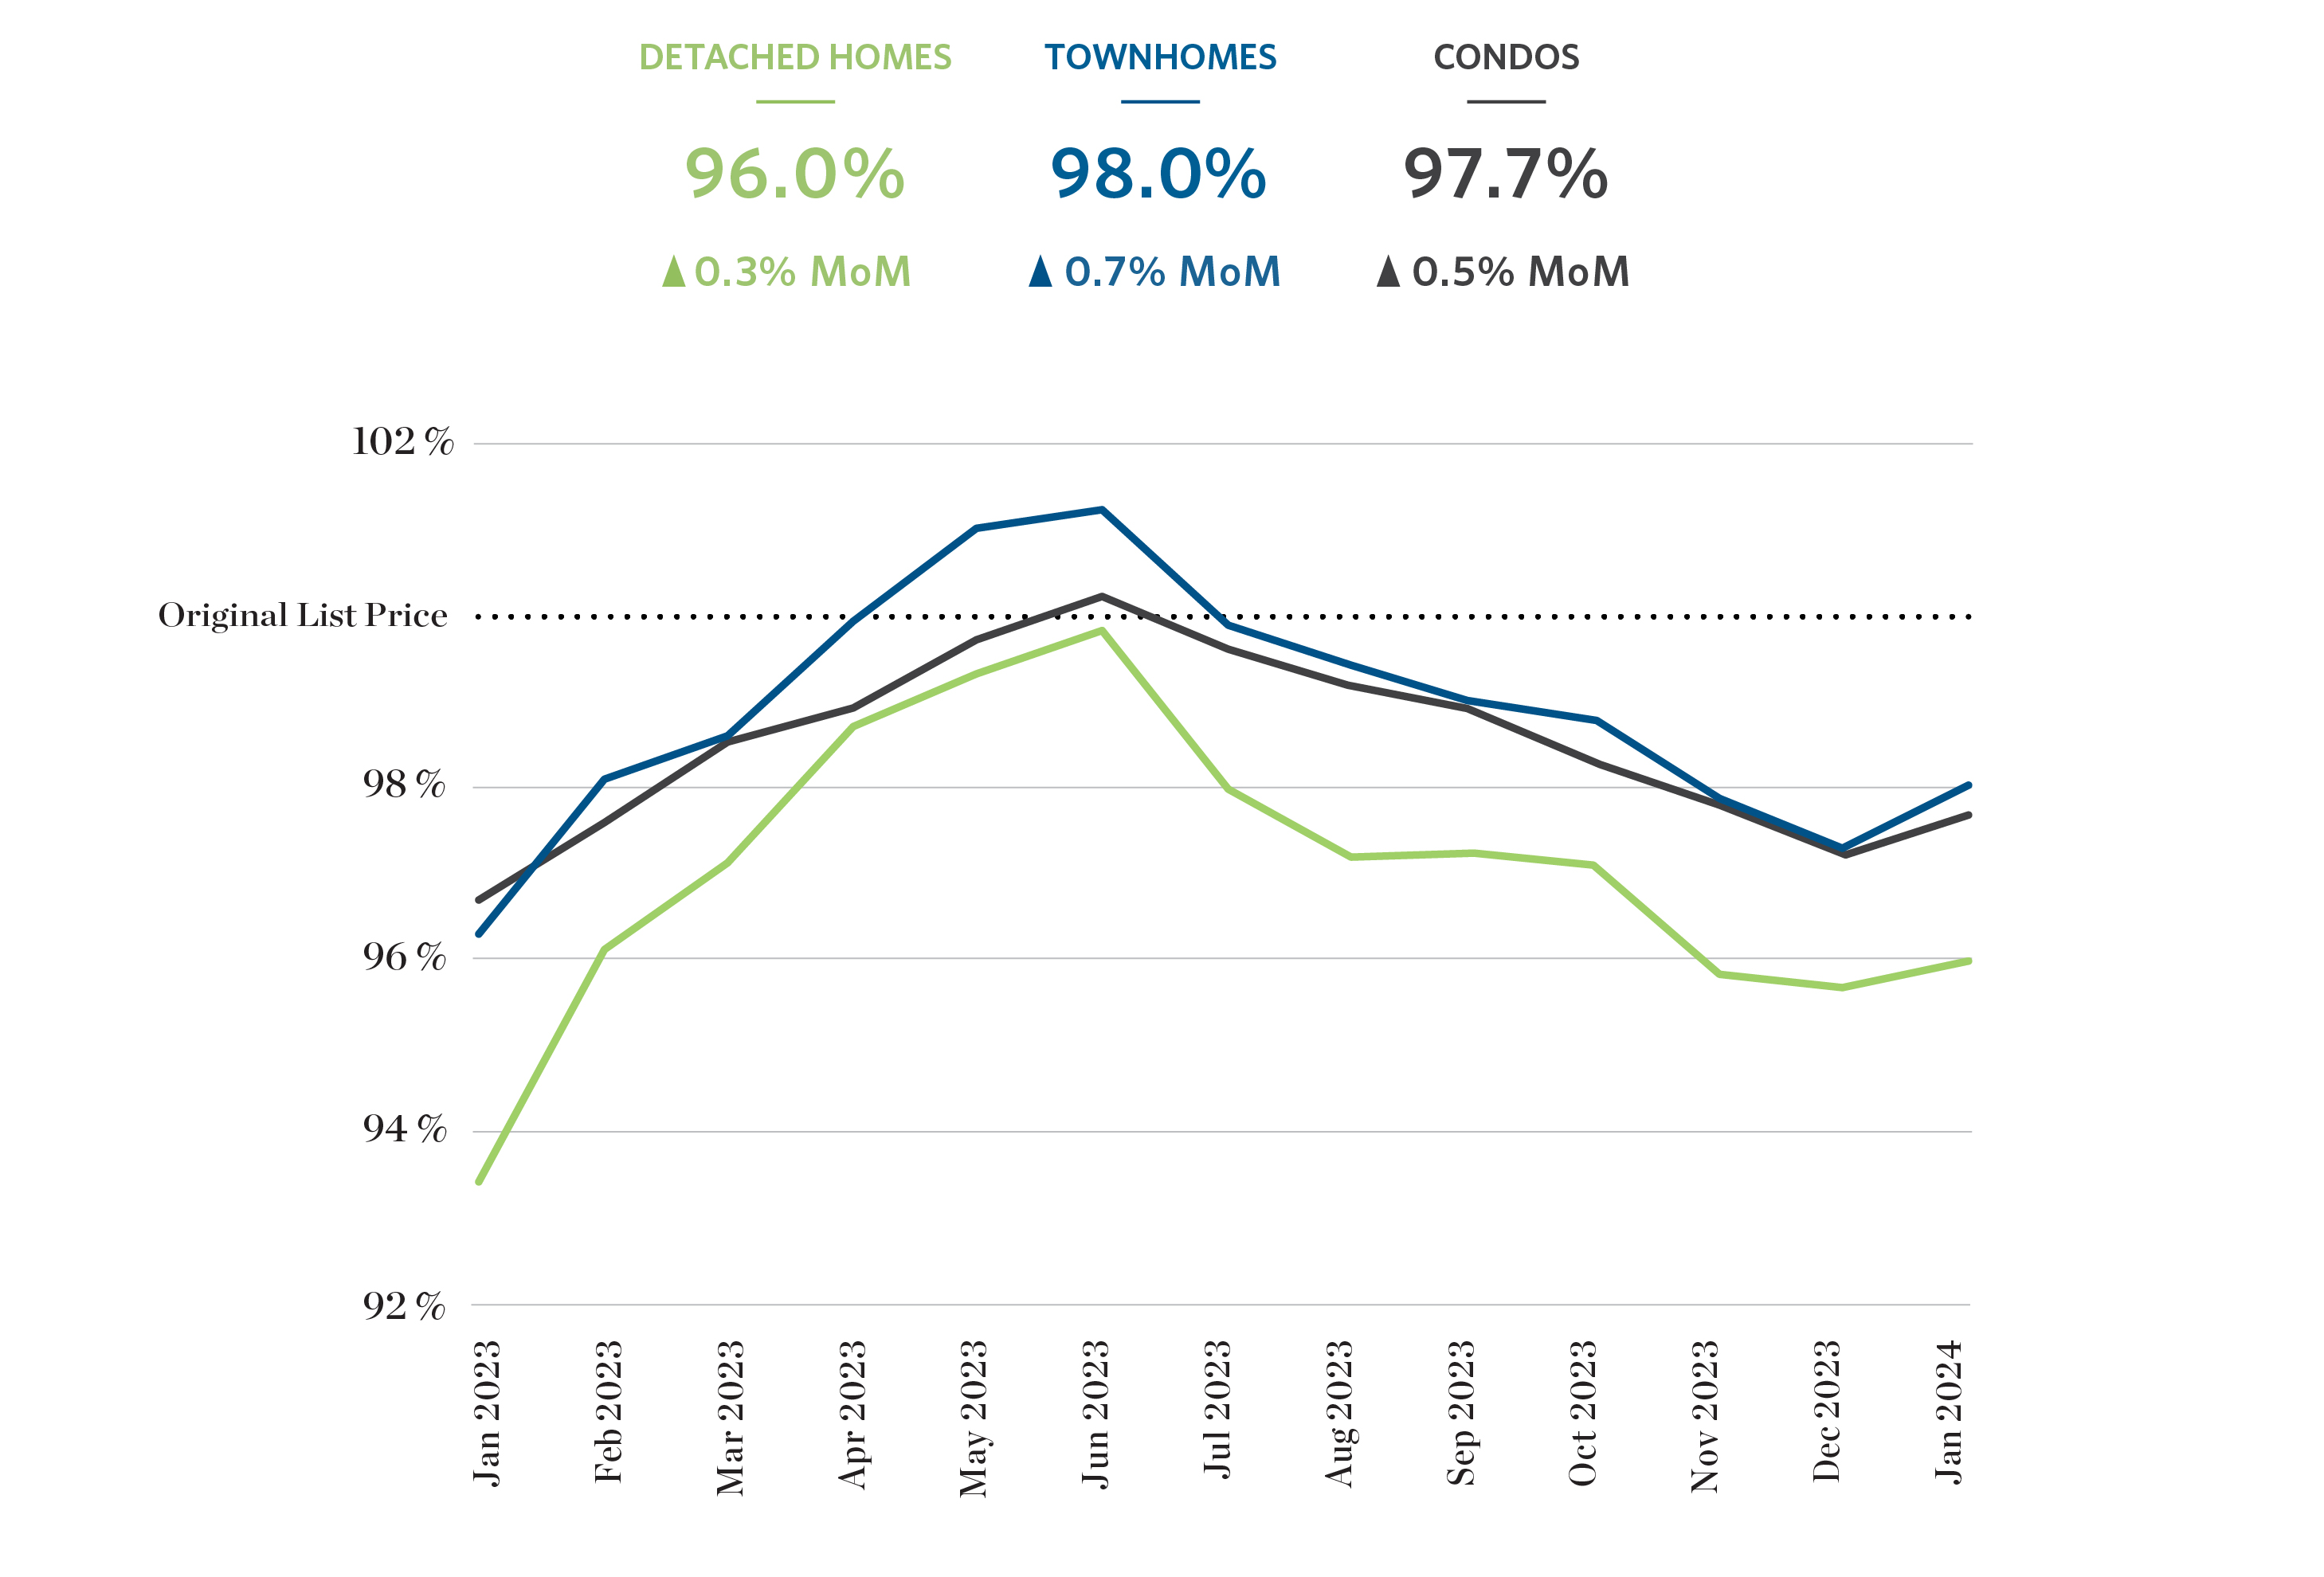
The average sale price as a percentage of the original list price remained steady overall, with minor increases across property types. Condos an increase of 0.5%, followed by detached homes at 0.3%, and townhomes at 0.7%. This suggests that sellers were able to negotiate prices slightly more than their initial listing values, albeit with some minor adjustments.
Days on Market
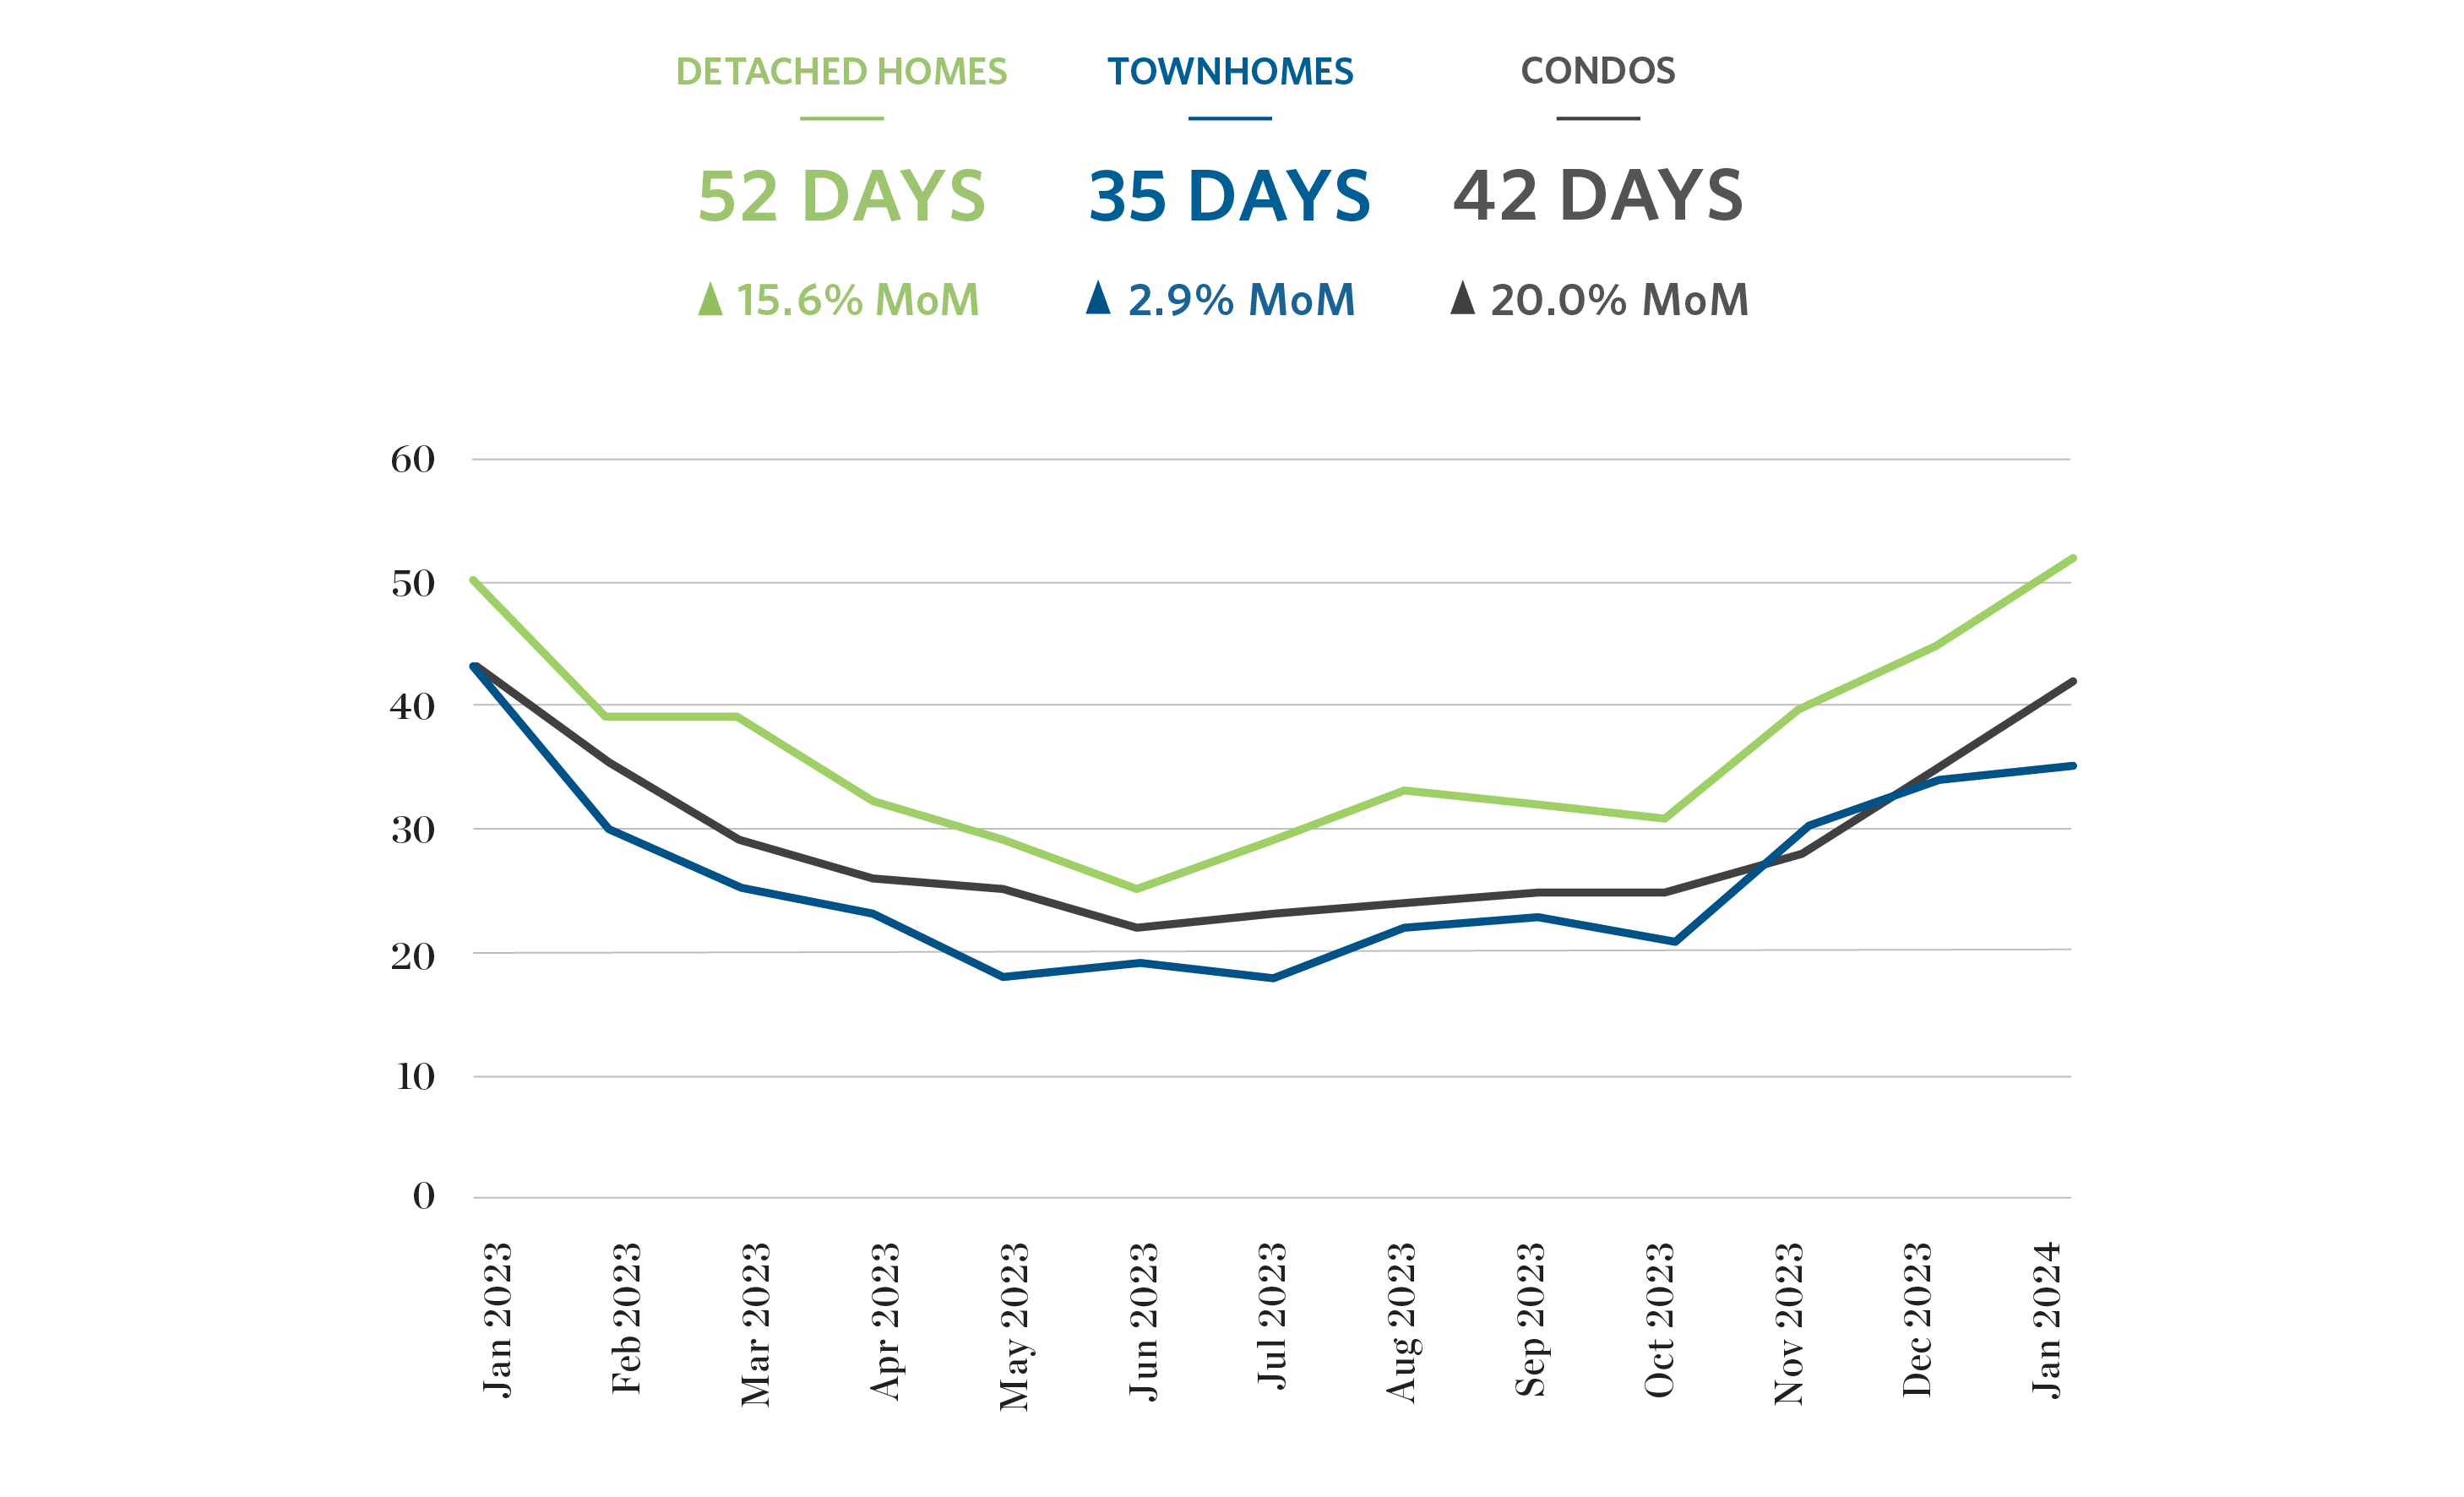
Properties in Metro Vancouver spent an average of 43 days on the market in January 2024. Detached homes took slightly longer at 52 days, while townhomes and apartments moved more quickly at 35 and 42 days, respectively.
Featured Homes
Looking for a new home? Check out these featured new homes courtesy of our affiliate company, Breakside Real Estate Group.

GREATER VANCOUVER RESIDENTIAL REAL ESTATE: january 2024 statistics in infographics
Sales To Active Listings Ratio
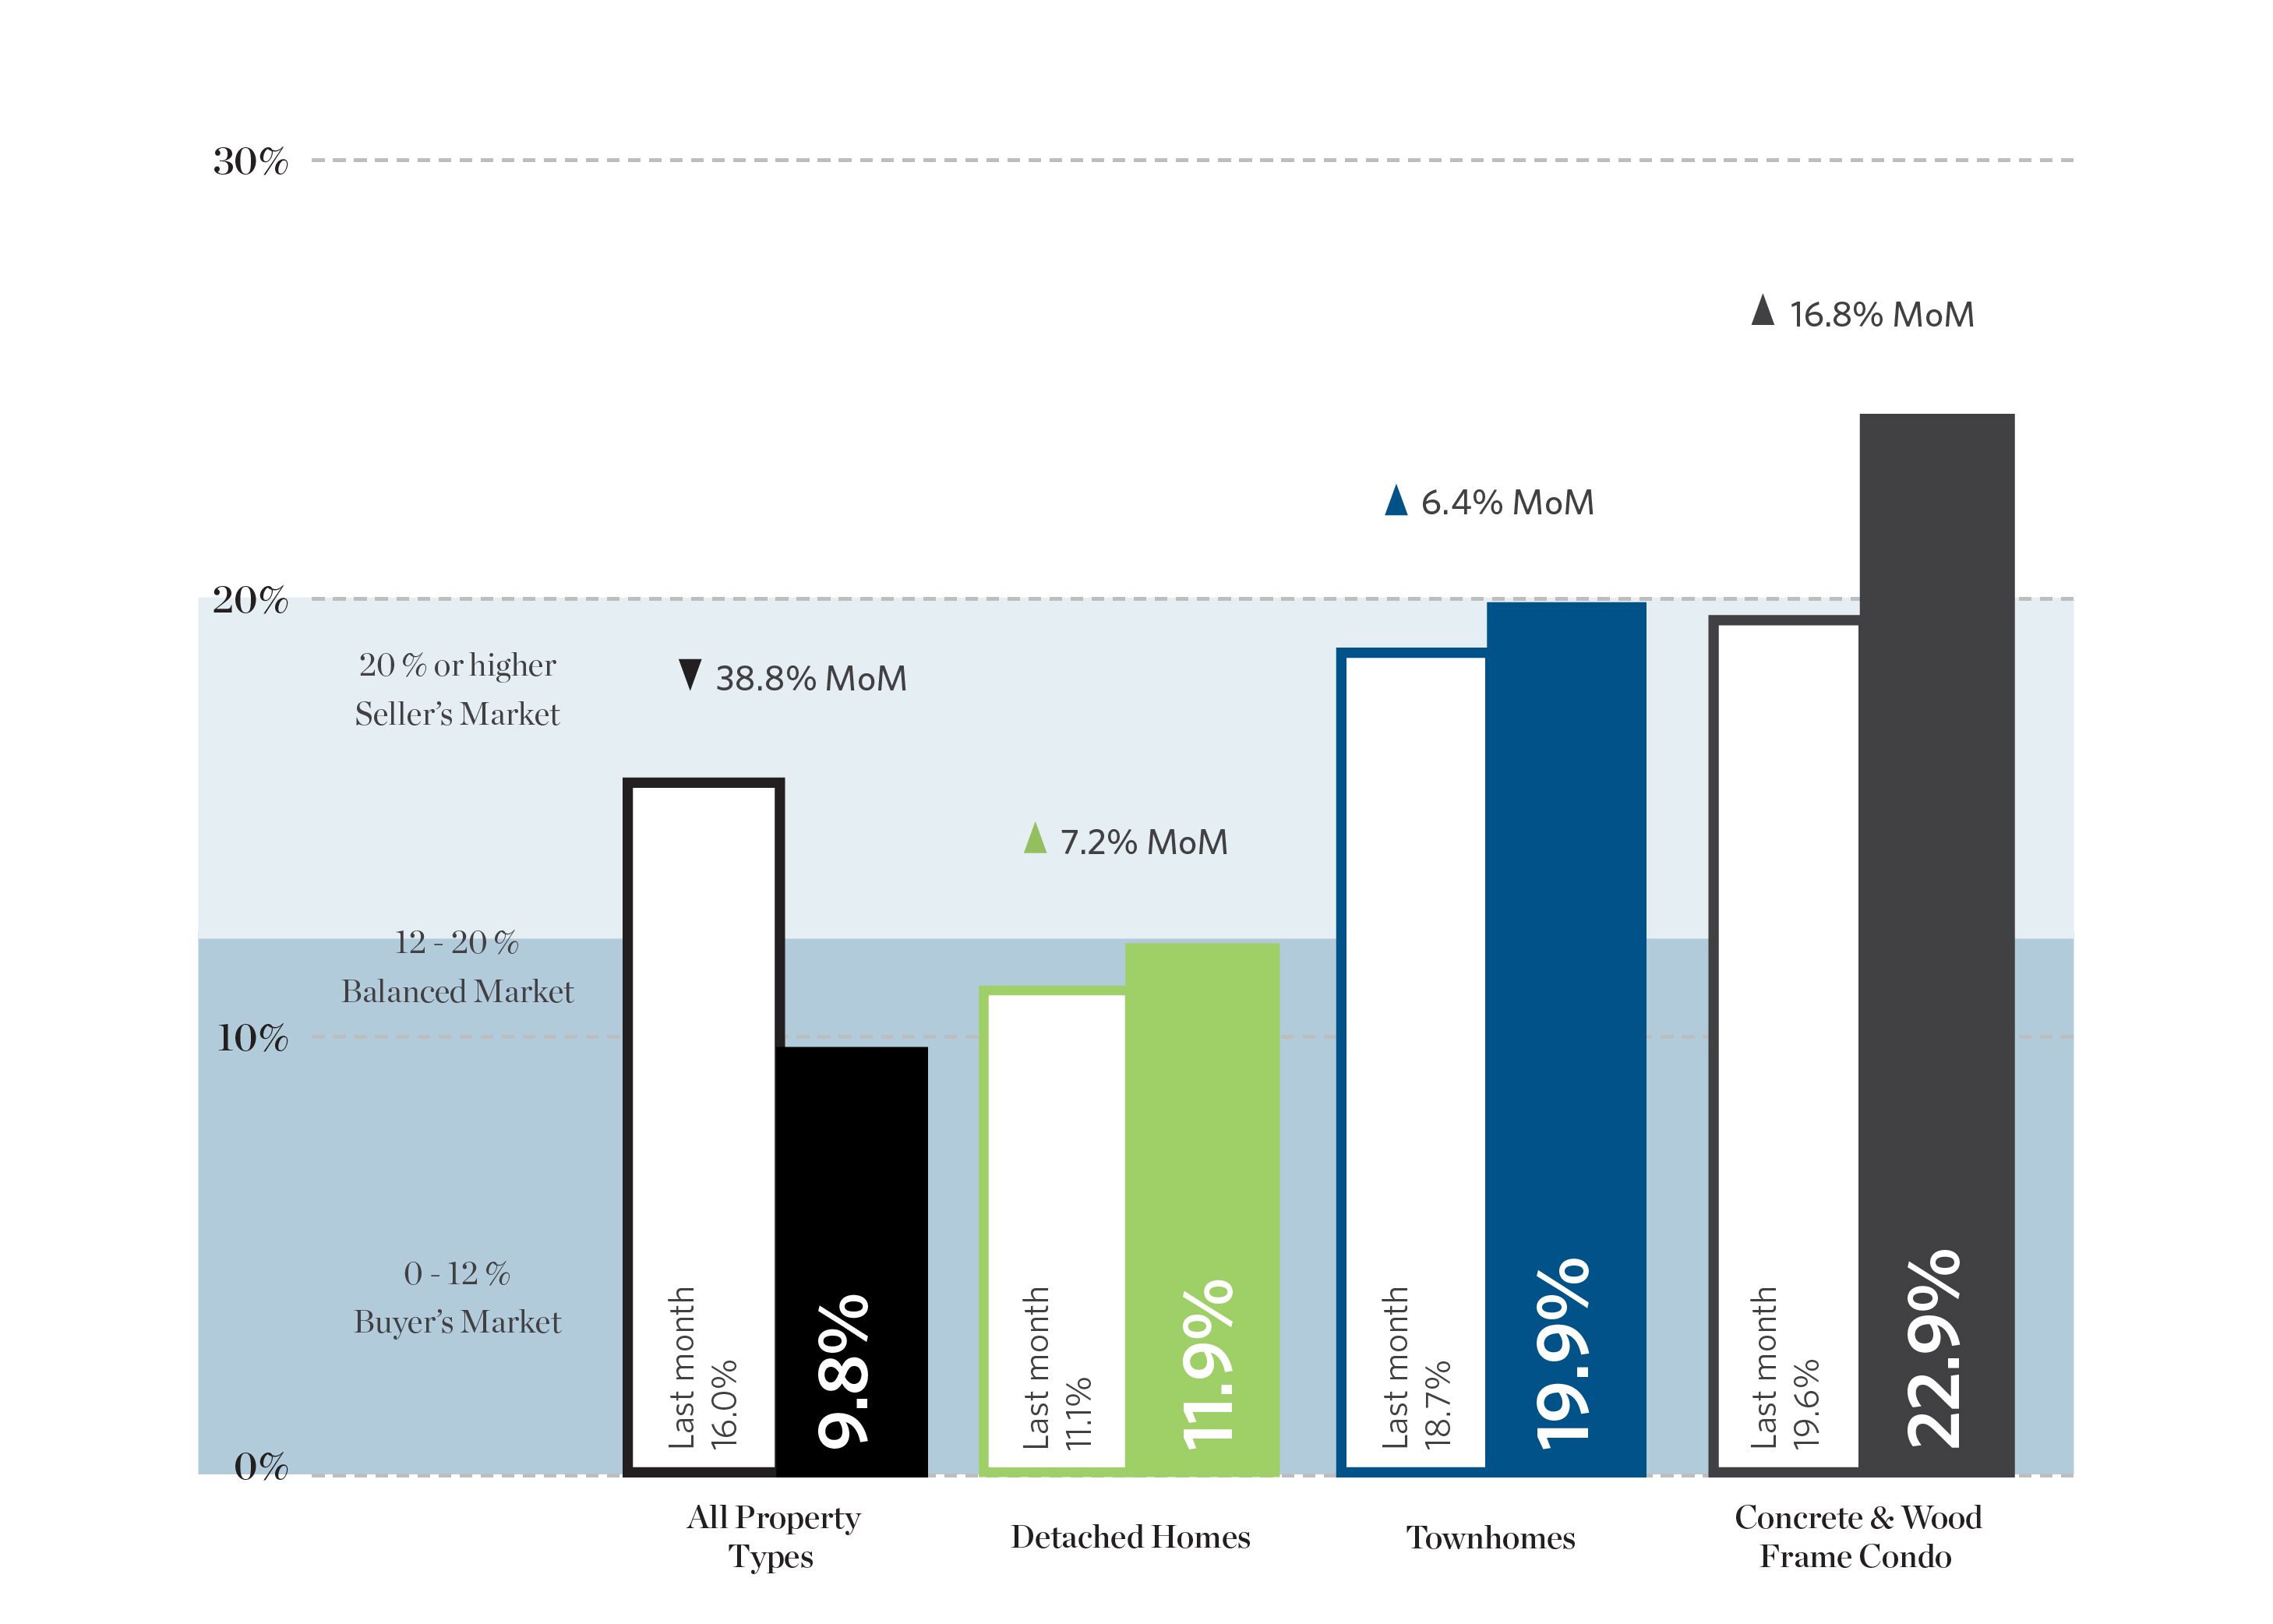
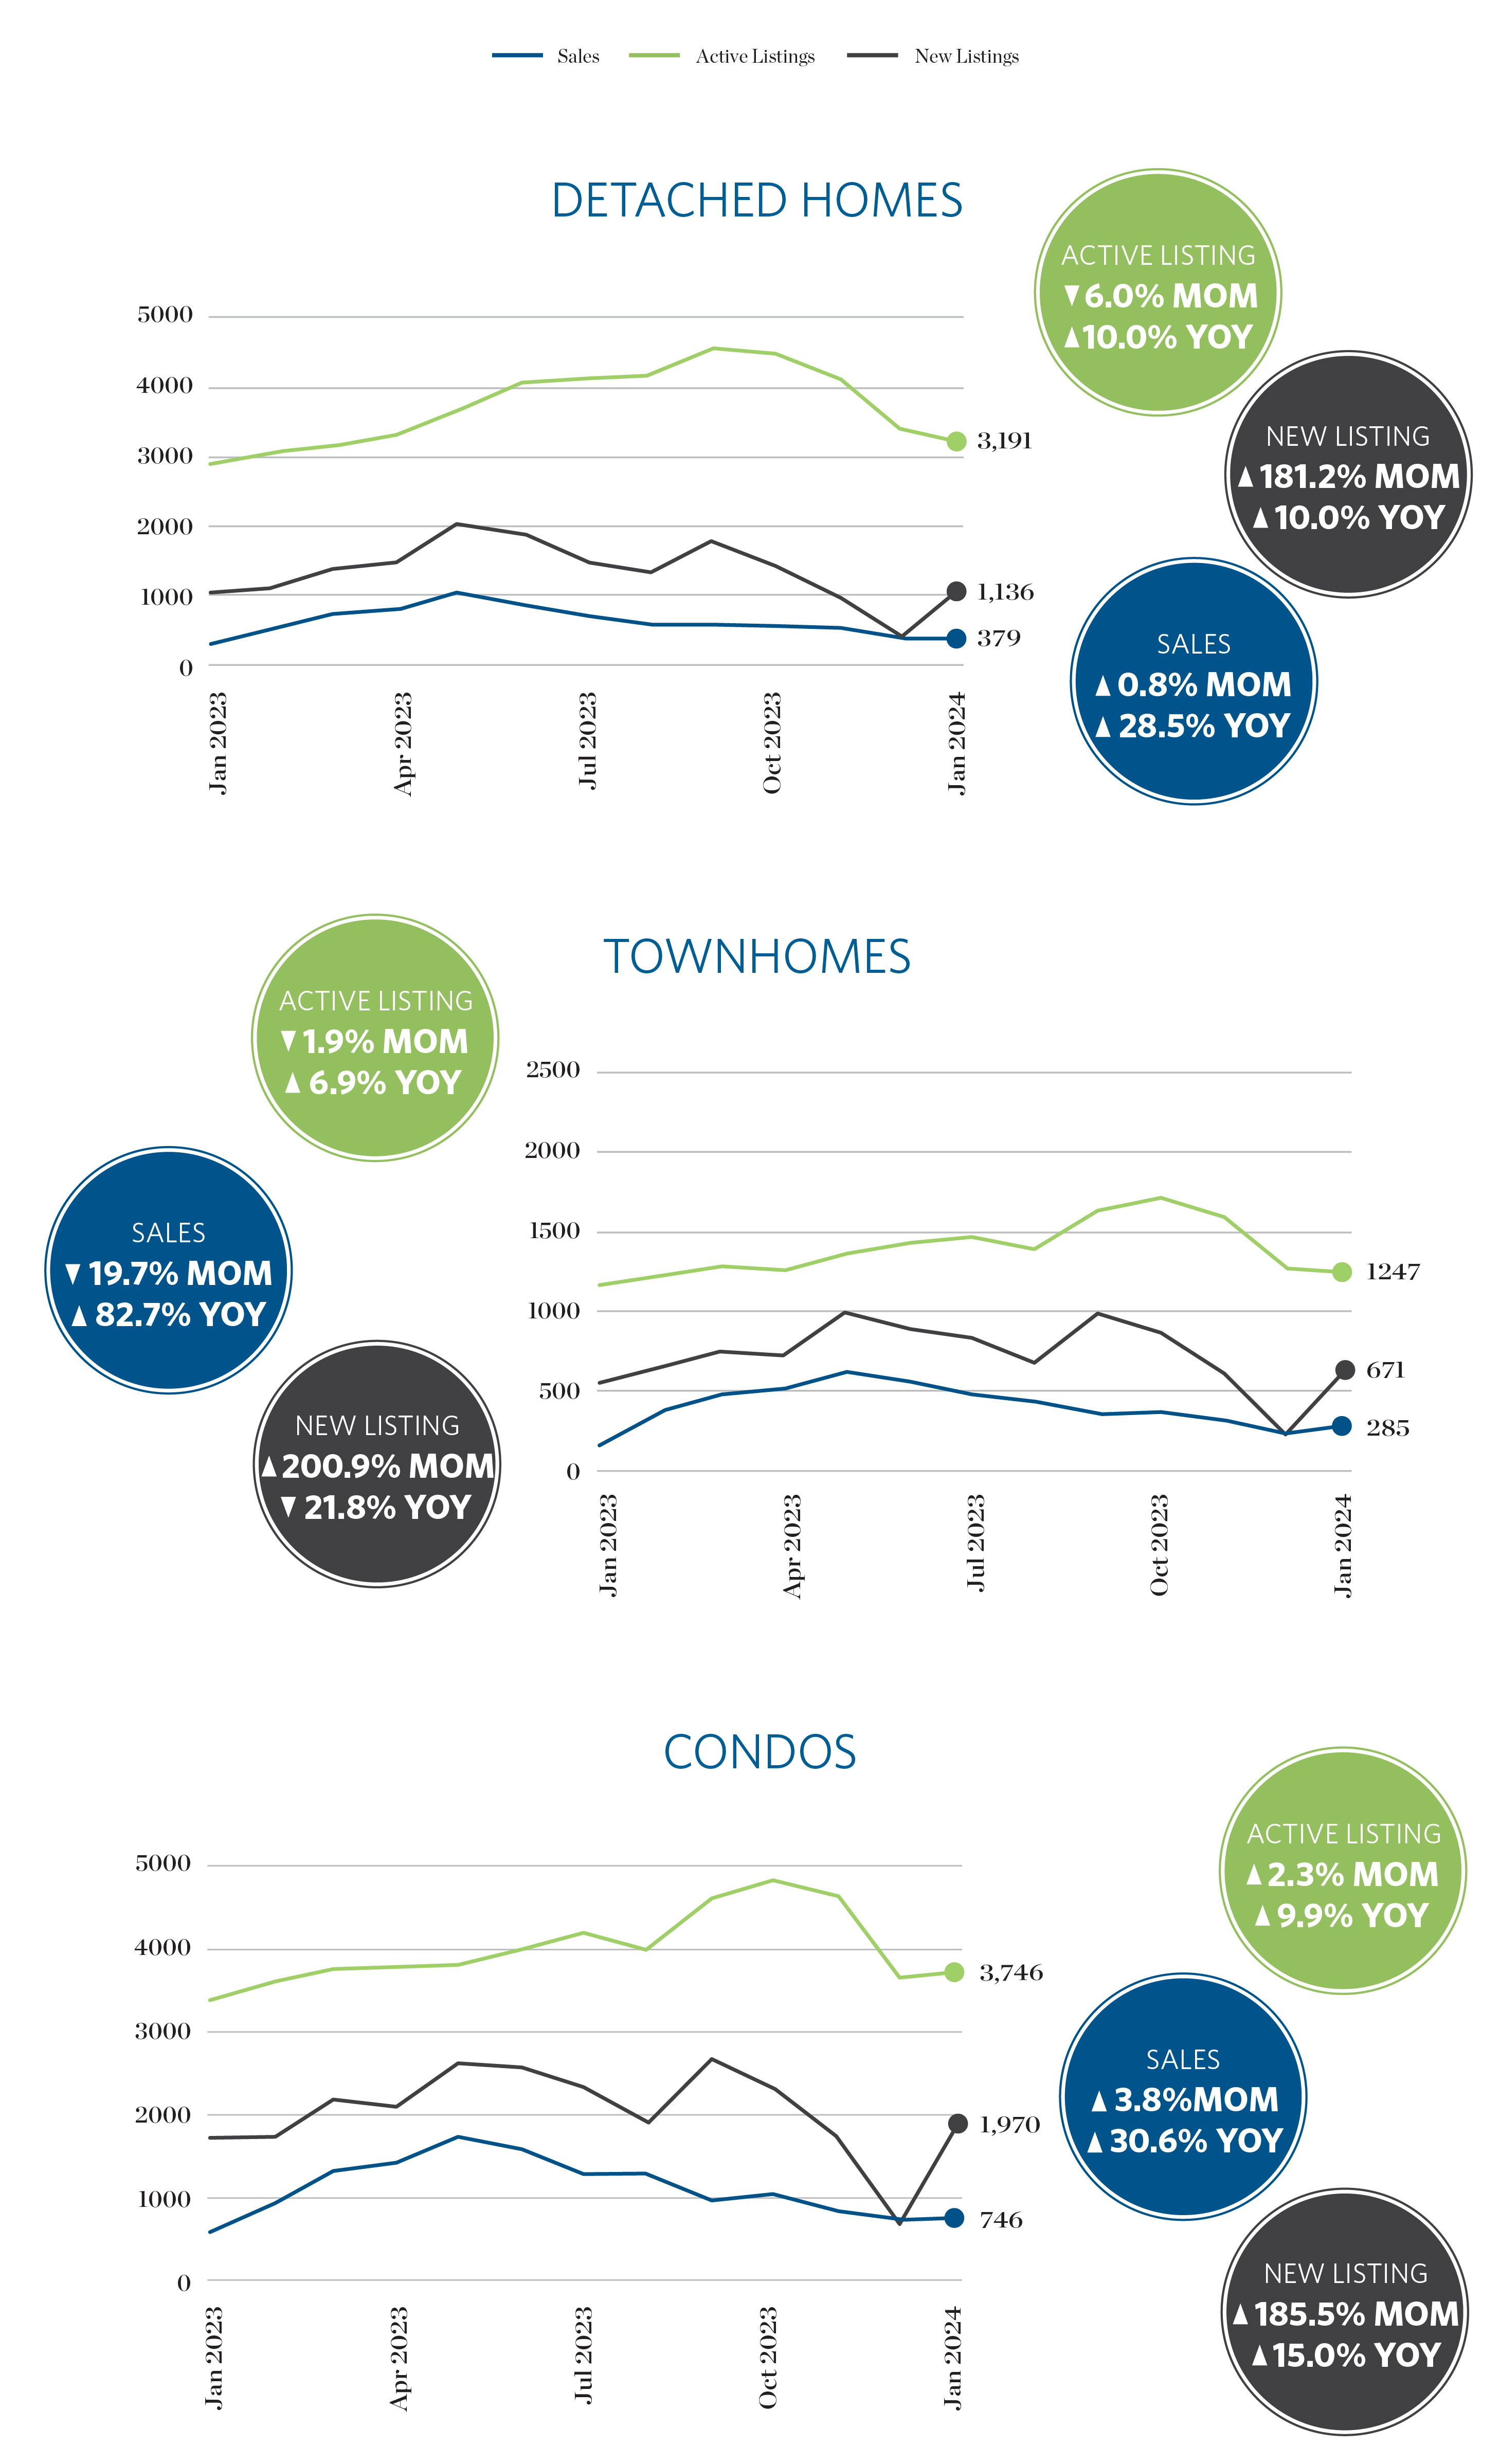
The sales-to-active listings ratio for January 2024 was 17.2%, indicating a market where demand slightly outpaced supply. However, by property type, detached homes had a lower ratio at 11.9%, suggesting a more balanced market for this segment, while attached homes and apartments remained in seller’s market territory at 22.9% and 19.9%, respectively.
HPI Benchmark Prices
The Home Price Index (HPI) measures the price of a benchmark, or typical, property in a given market and is not influenced by the change in composition of properties sold, which can fluctuate quite significantly from month to month. As a result, this metric is a more pure and stable representation of market price change than average or median prices.
In January 2024, the composite benchmark price for all residential properties was $1,161,300, up 4.2% from January 2023 but down 0.6% from December 2023. Detached homes reached $1,942,400, up 7.8% year-over-year but down 1.1% from December 2023. Apartments were at $751,900, up 4.3% from January 2023 and 0.1% from December 2023 and Townhomes experienced a decrease of 0.6% from last month but a 4.5% increase from last year. These figures reveal both overall price growth and recent fluctuations in Metro Vancouver’s housing market.
Sales • New Listings • Active Listings
In January 2024, Metro Vancouver’s real estate market showed robust sales activity, with 1,427 residential properties sold, marking a significant 38.5% increase from January 2023. New listings also increased by 14.5% compared to January 2023, reaching 3,788 properties, indicating a growing supply of homes entering the market. The total number of active listings in January 2024 was 8,633, up 9.8% from January 2023, suggesting a steady increase in available inventory. These trends point to a dynamic market with strong demand and an expanding supply of homes for sale in Metro Vancouver.
Further Reading
View the Real Estate Board of Greater Vancouver’s entire stats package for January 2024 here.
Please note: areas covered by the Real Estate Board of Greater Vancouver include: Whistler, Sunshine Coast, Squamish, West Vancouver, North Vancouver, Vancouver, Burnaby, New Westminster, Richmond, Port Moody, Port Coquitlam, Coquitlam, Pitt Meadows, Maple Ridge, and South Delta.
Sources
Sources: Breakside Real Estate Group, Real Estate Board of Greater Vancouver
This representation is based in whole or in part on data generated by the Real Estate Board of Greater Vancouver which assumes no responsibility for its accuracy.


