Infographic: Greater Vancouver Residential Real Estate November 2023
Despite the reprieve from the ongoing decline in benchmark prices and sales seen in October, the downward trend resumed in November. This reduction in sales may be attributable to the approach of the holidays and continued hesitation caused by market uncertainty.
These residential market statistics from the Real Estate Board of Greater Vancouver provide insight into the current state of the residential home market, including home values, which directly impact the development land market. Contact us today if you would like to learn what your property is worth on the development land market.
KEY TAKEAWAYS FROM NOVEMBER 2023 GREATER VANCOUVER RESIDENTIAL MARKET
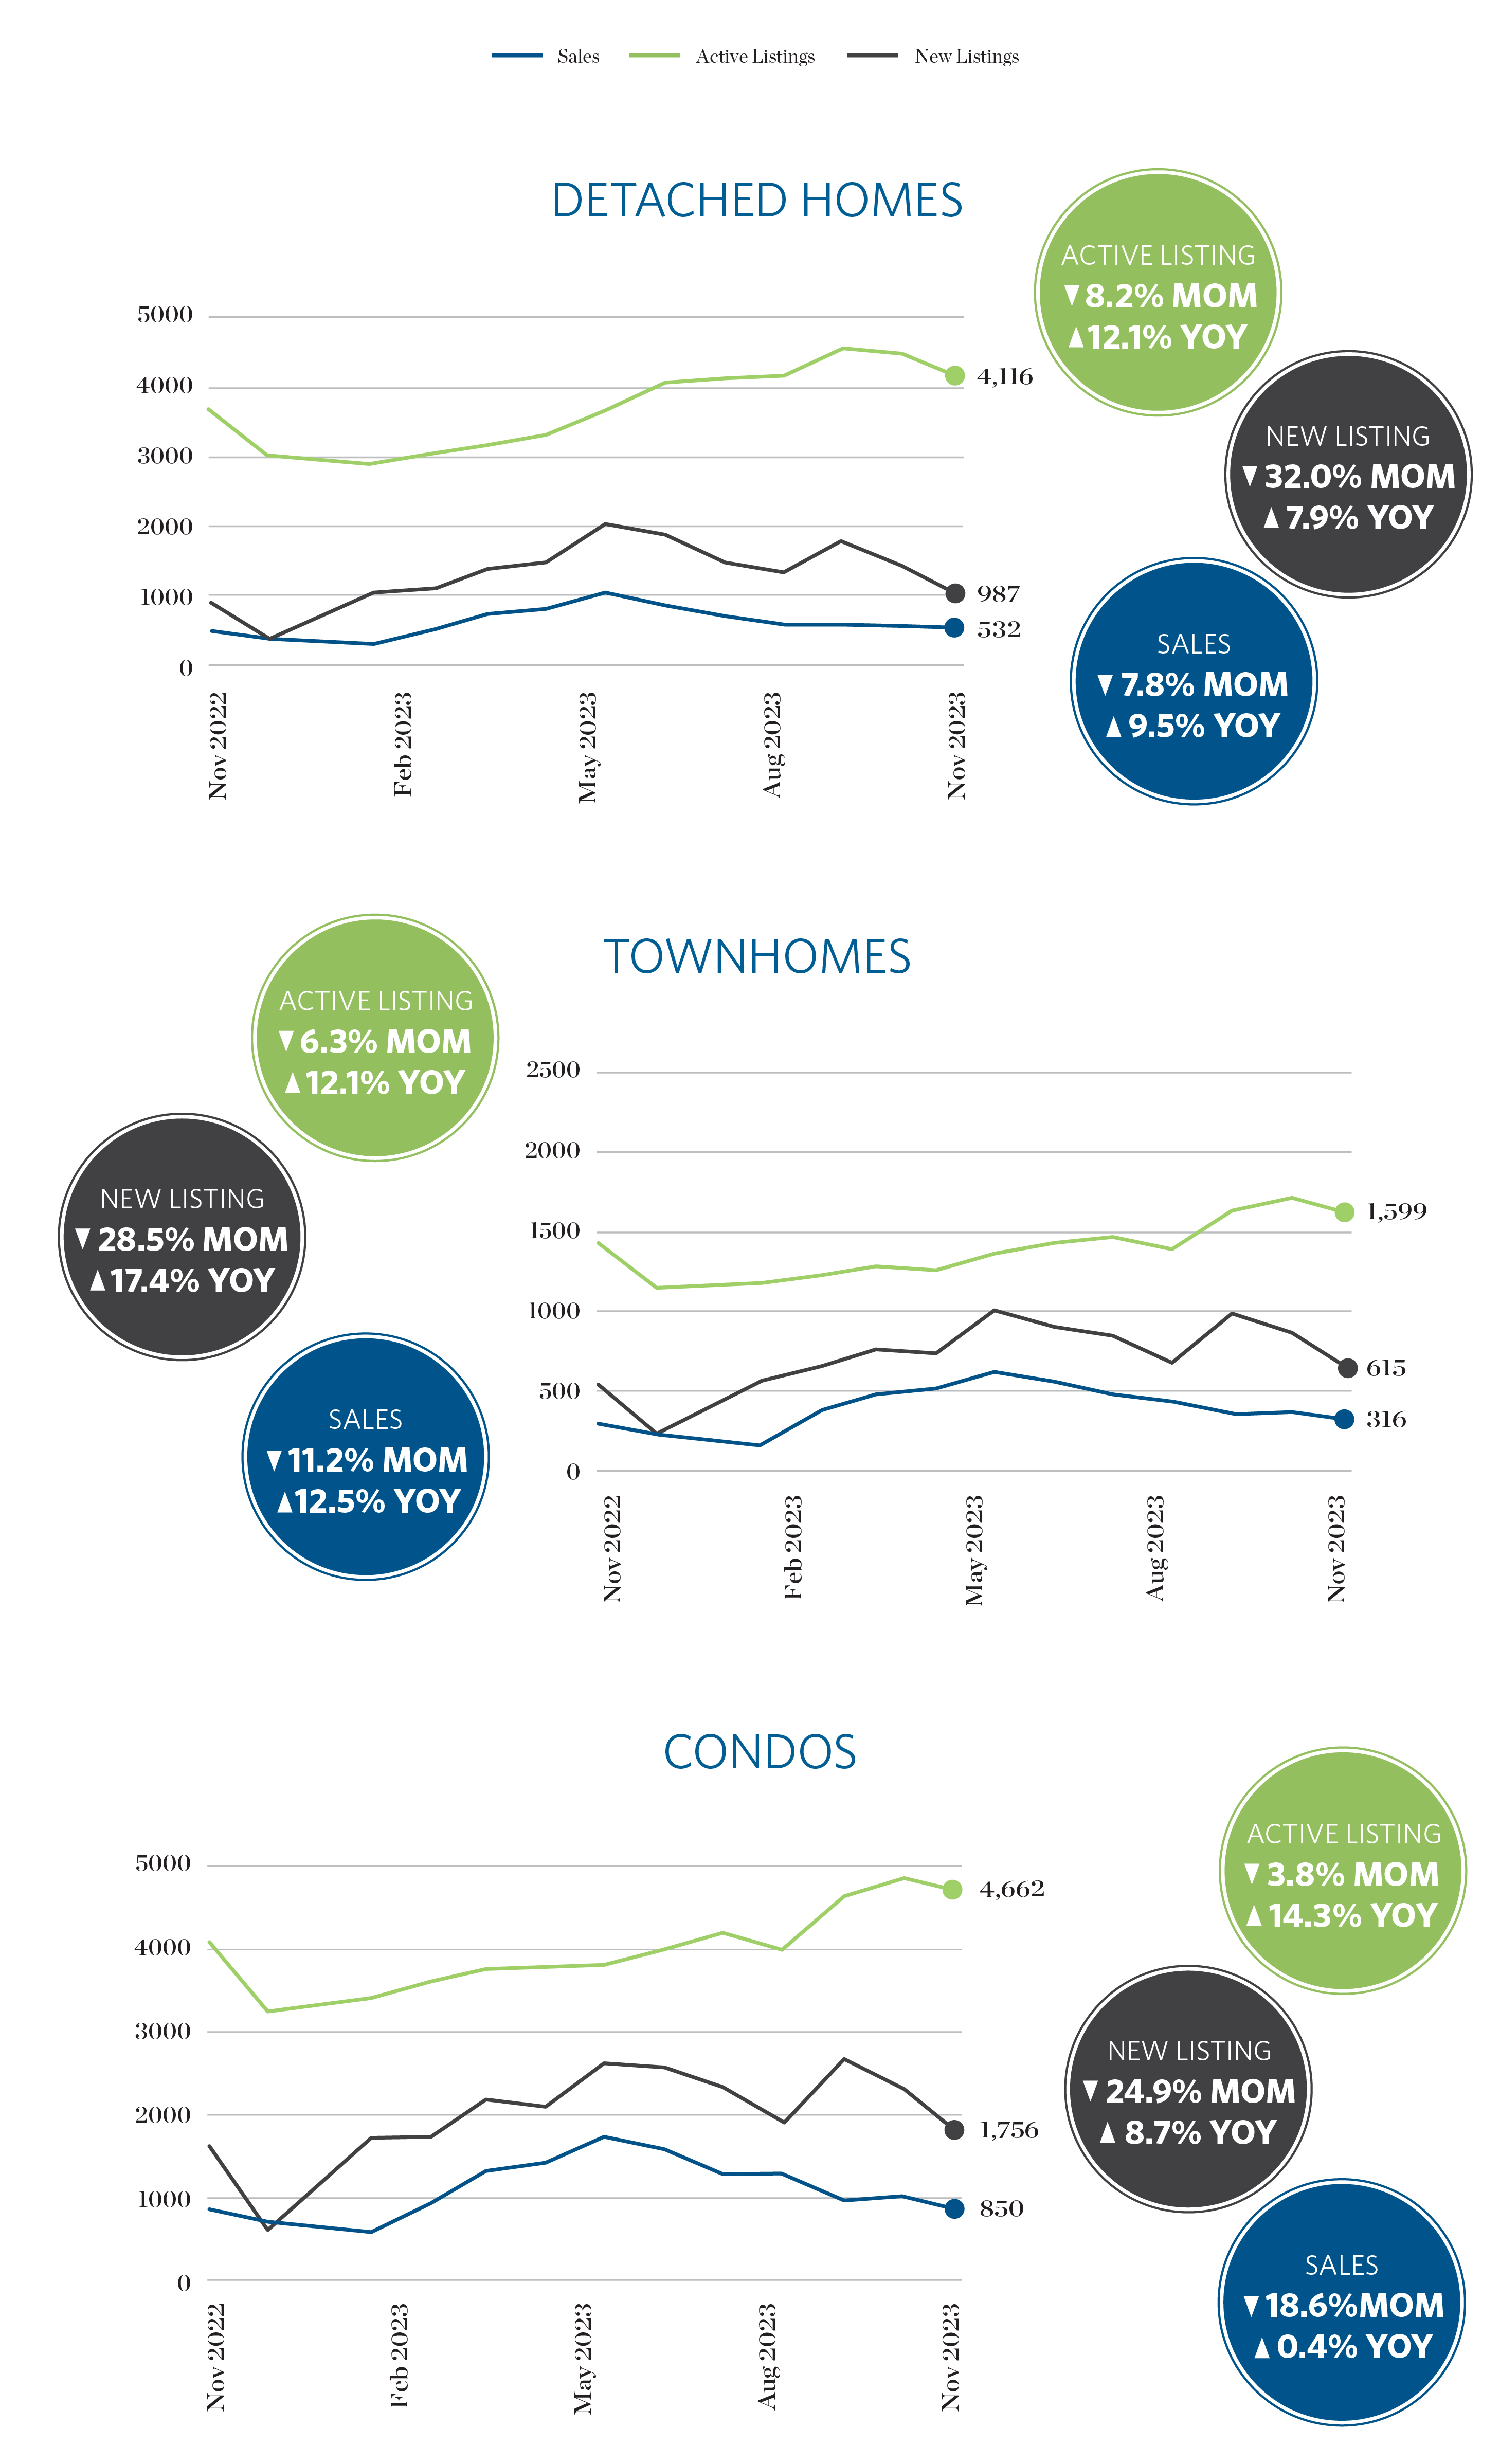
- All property types saw a drop in sales and a drastic increase in the time spent on the market in November compared to October.
- Active and new listings across all property types decreased in November compared to October, however this may be attributed to the approaching holiday season as the year over year comparison shows an approximately 12.8% increase in the number of active listings when compared to the same period of last year.
- The Home Price Index composite benchmark price for all properties increased an average of 6.4% compared to November of 2022, though each property type saw a minor decrease from October 2023.
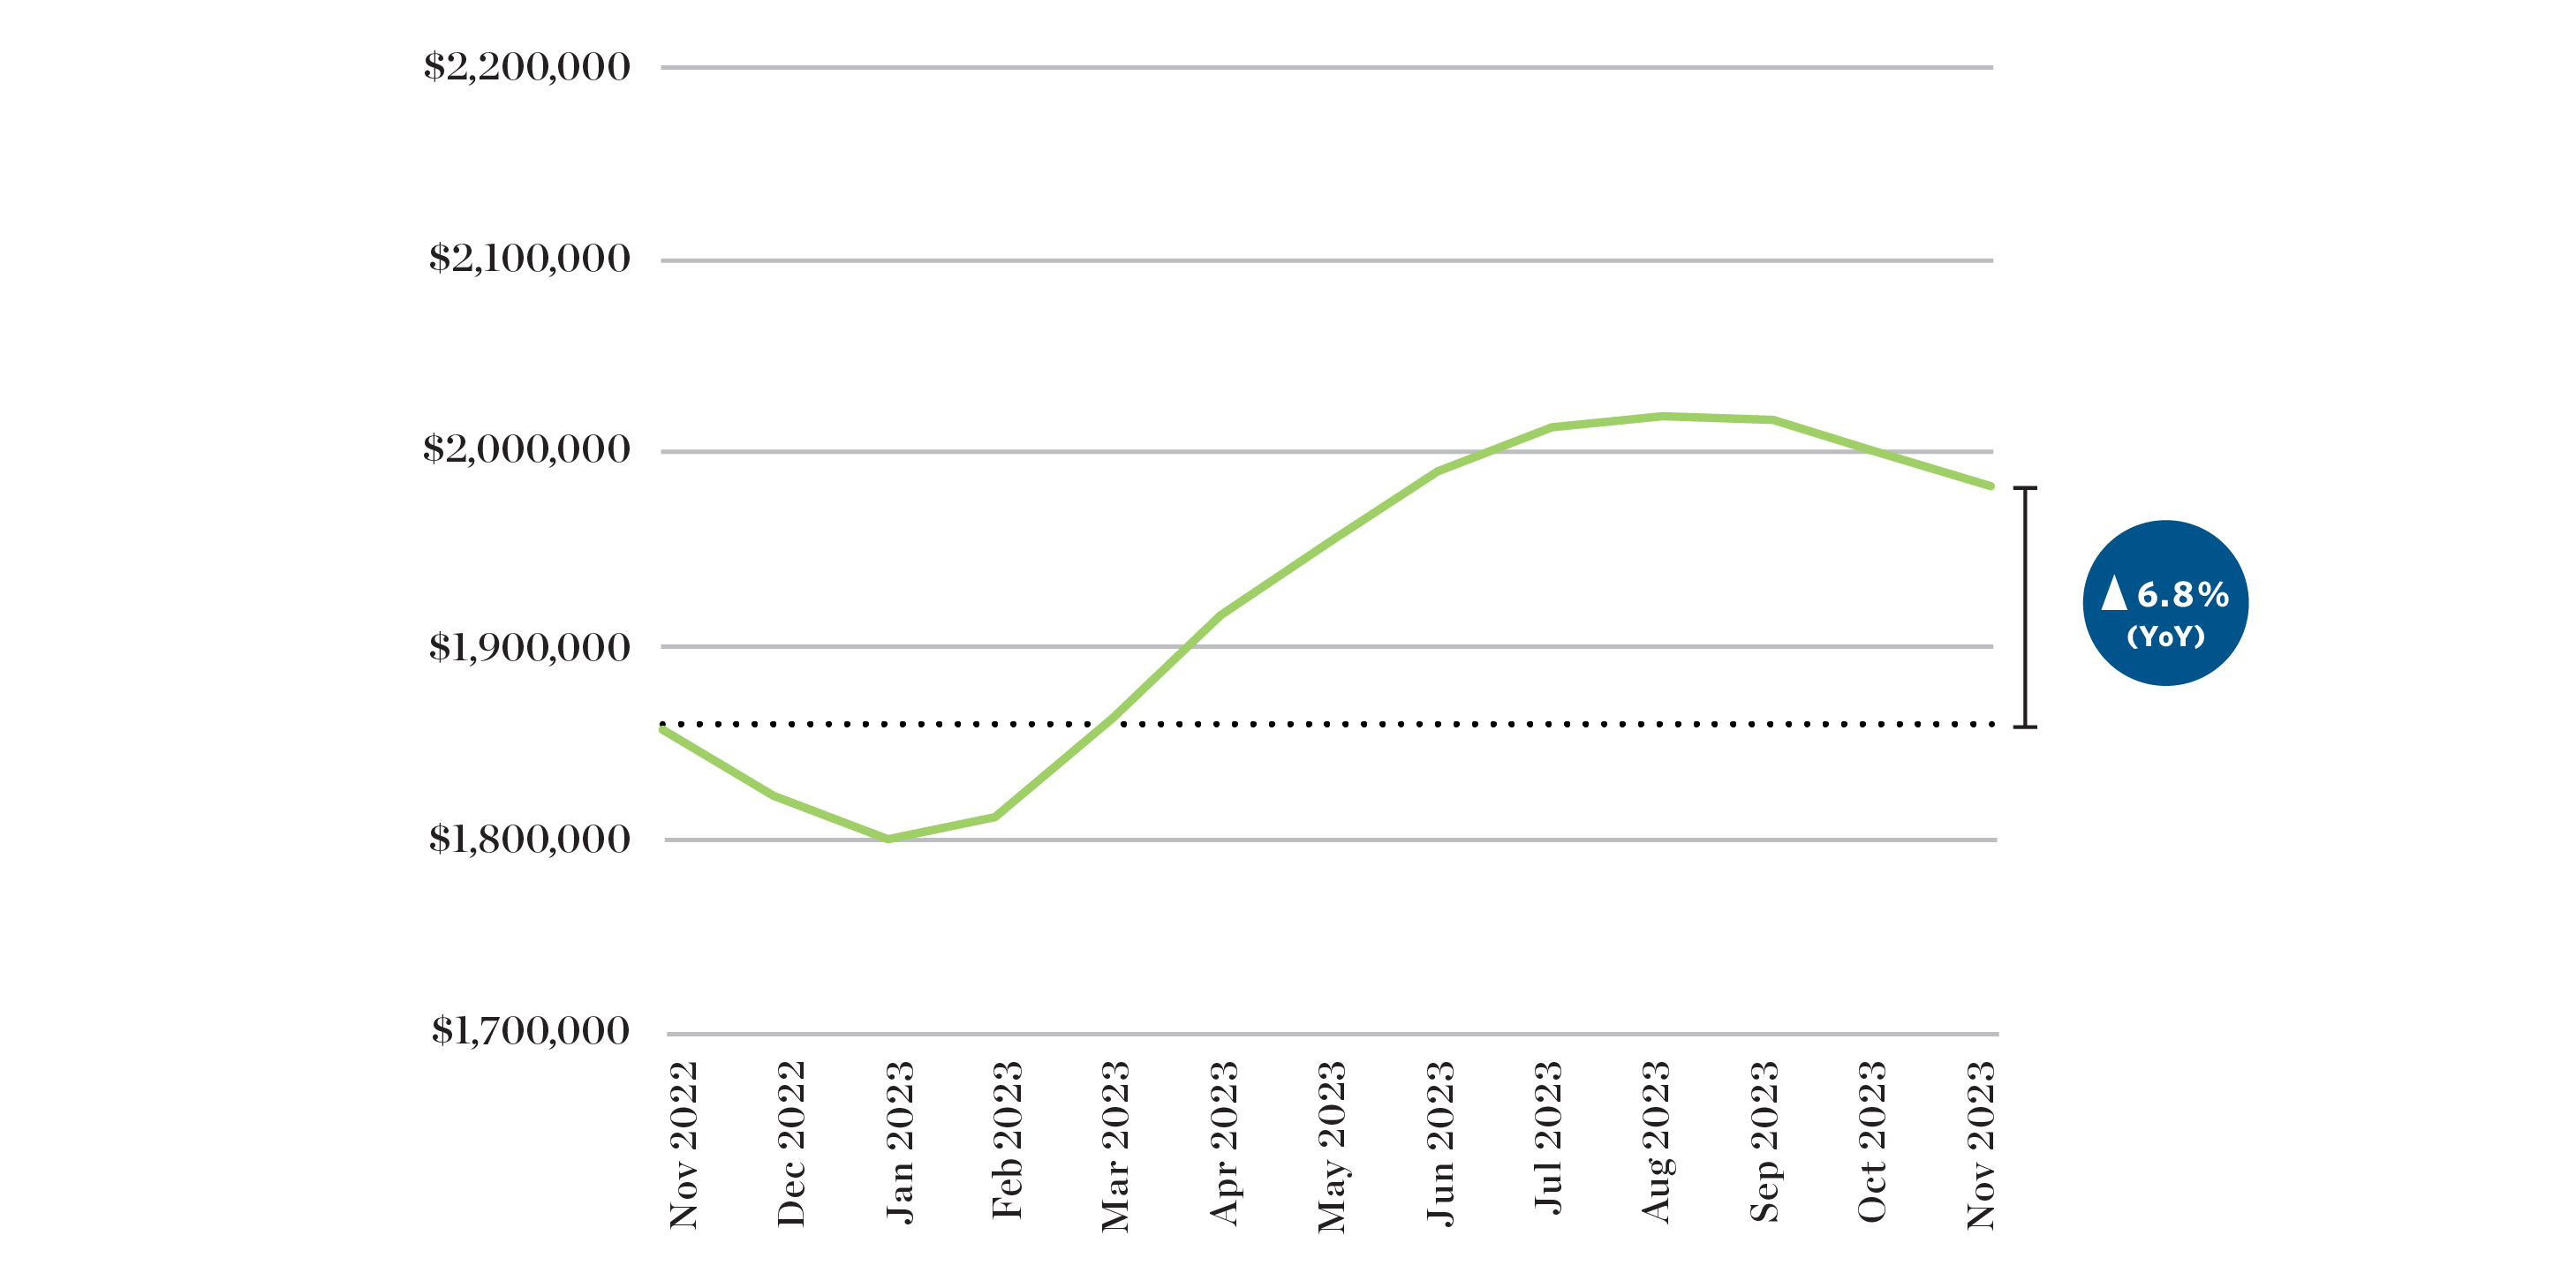
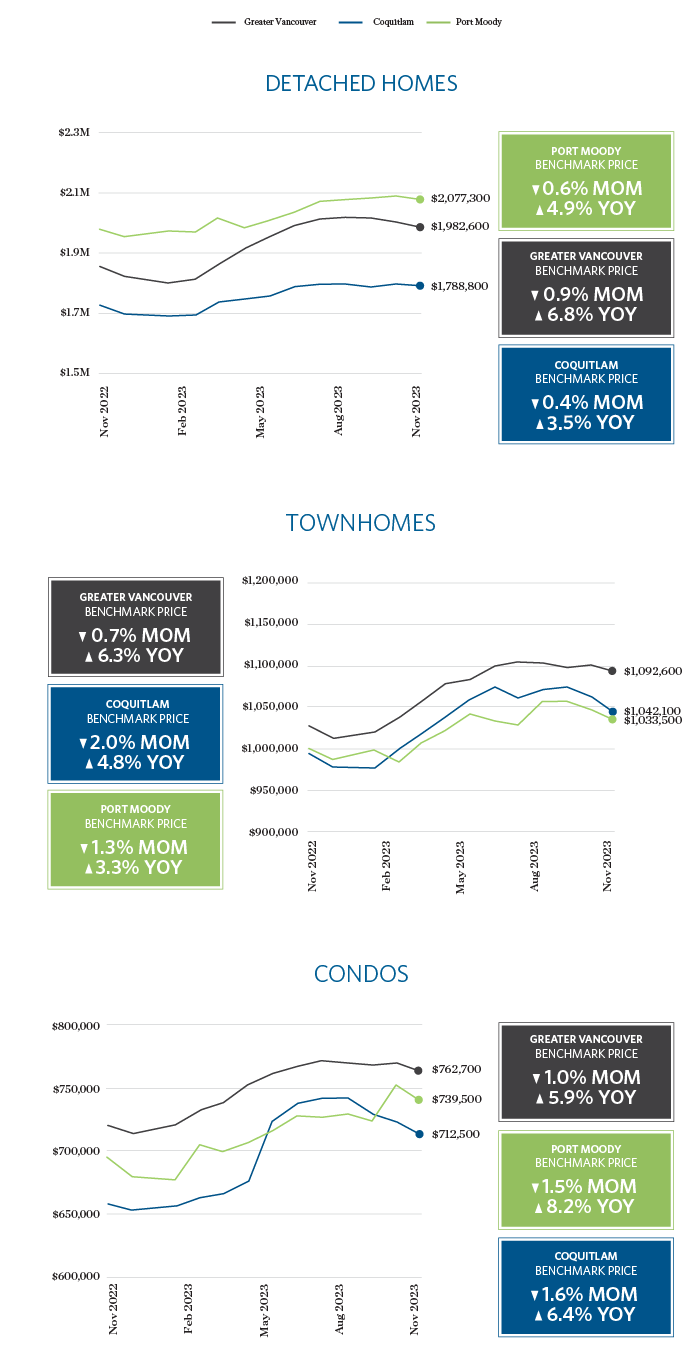
HPI Benchmark Price of Detached Homes
The decrease in the HPI benchmark price for detached homes in Metro Vancouver continues to fall for the third consecutive month. Despite this reduction, the year-over-year comparison indicates growth of 6.8% when compared to the same month in 2022.
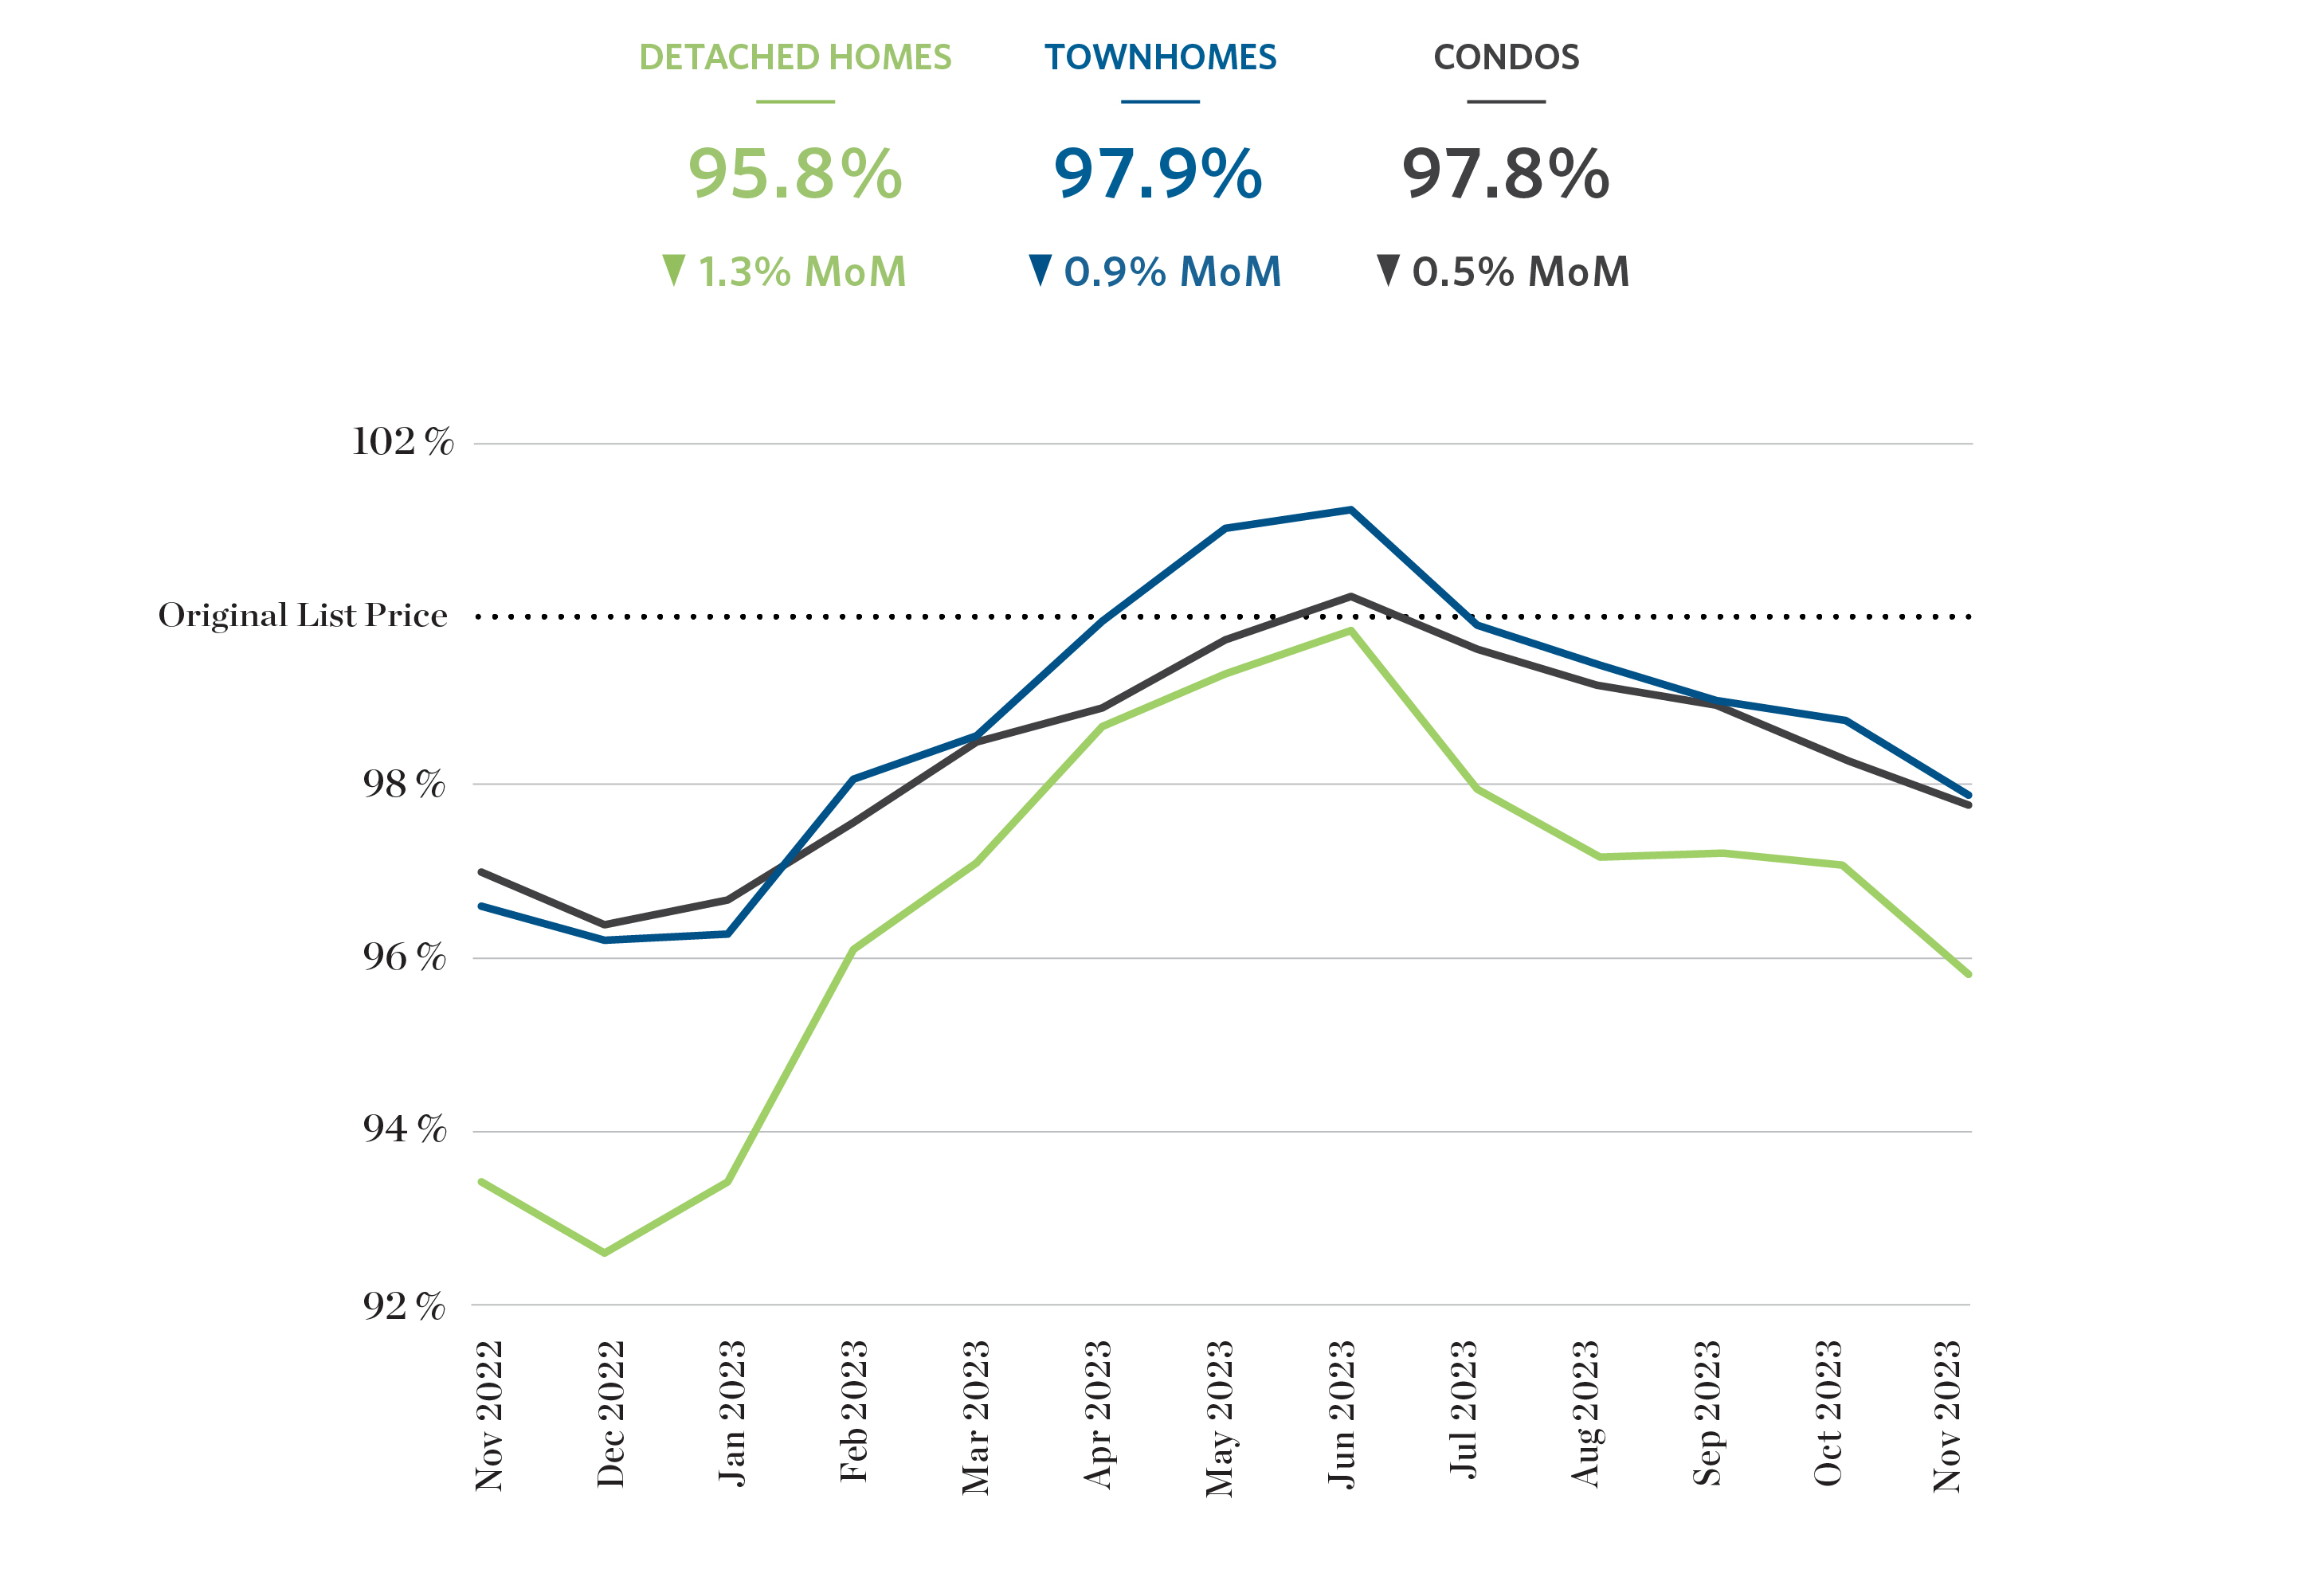
Sale Price As a Percent of Original List Price
The average sale price as a percentage of original list price decreased slightly from their original list prices between October 2023 and November 2023. However, it’s important to note that these percentages can fluctuate based on various factors such as market conditions, supply and demand dynamics, and individual property characteristics.
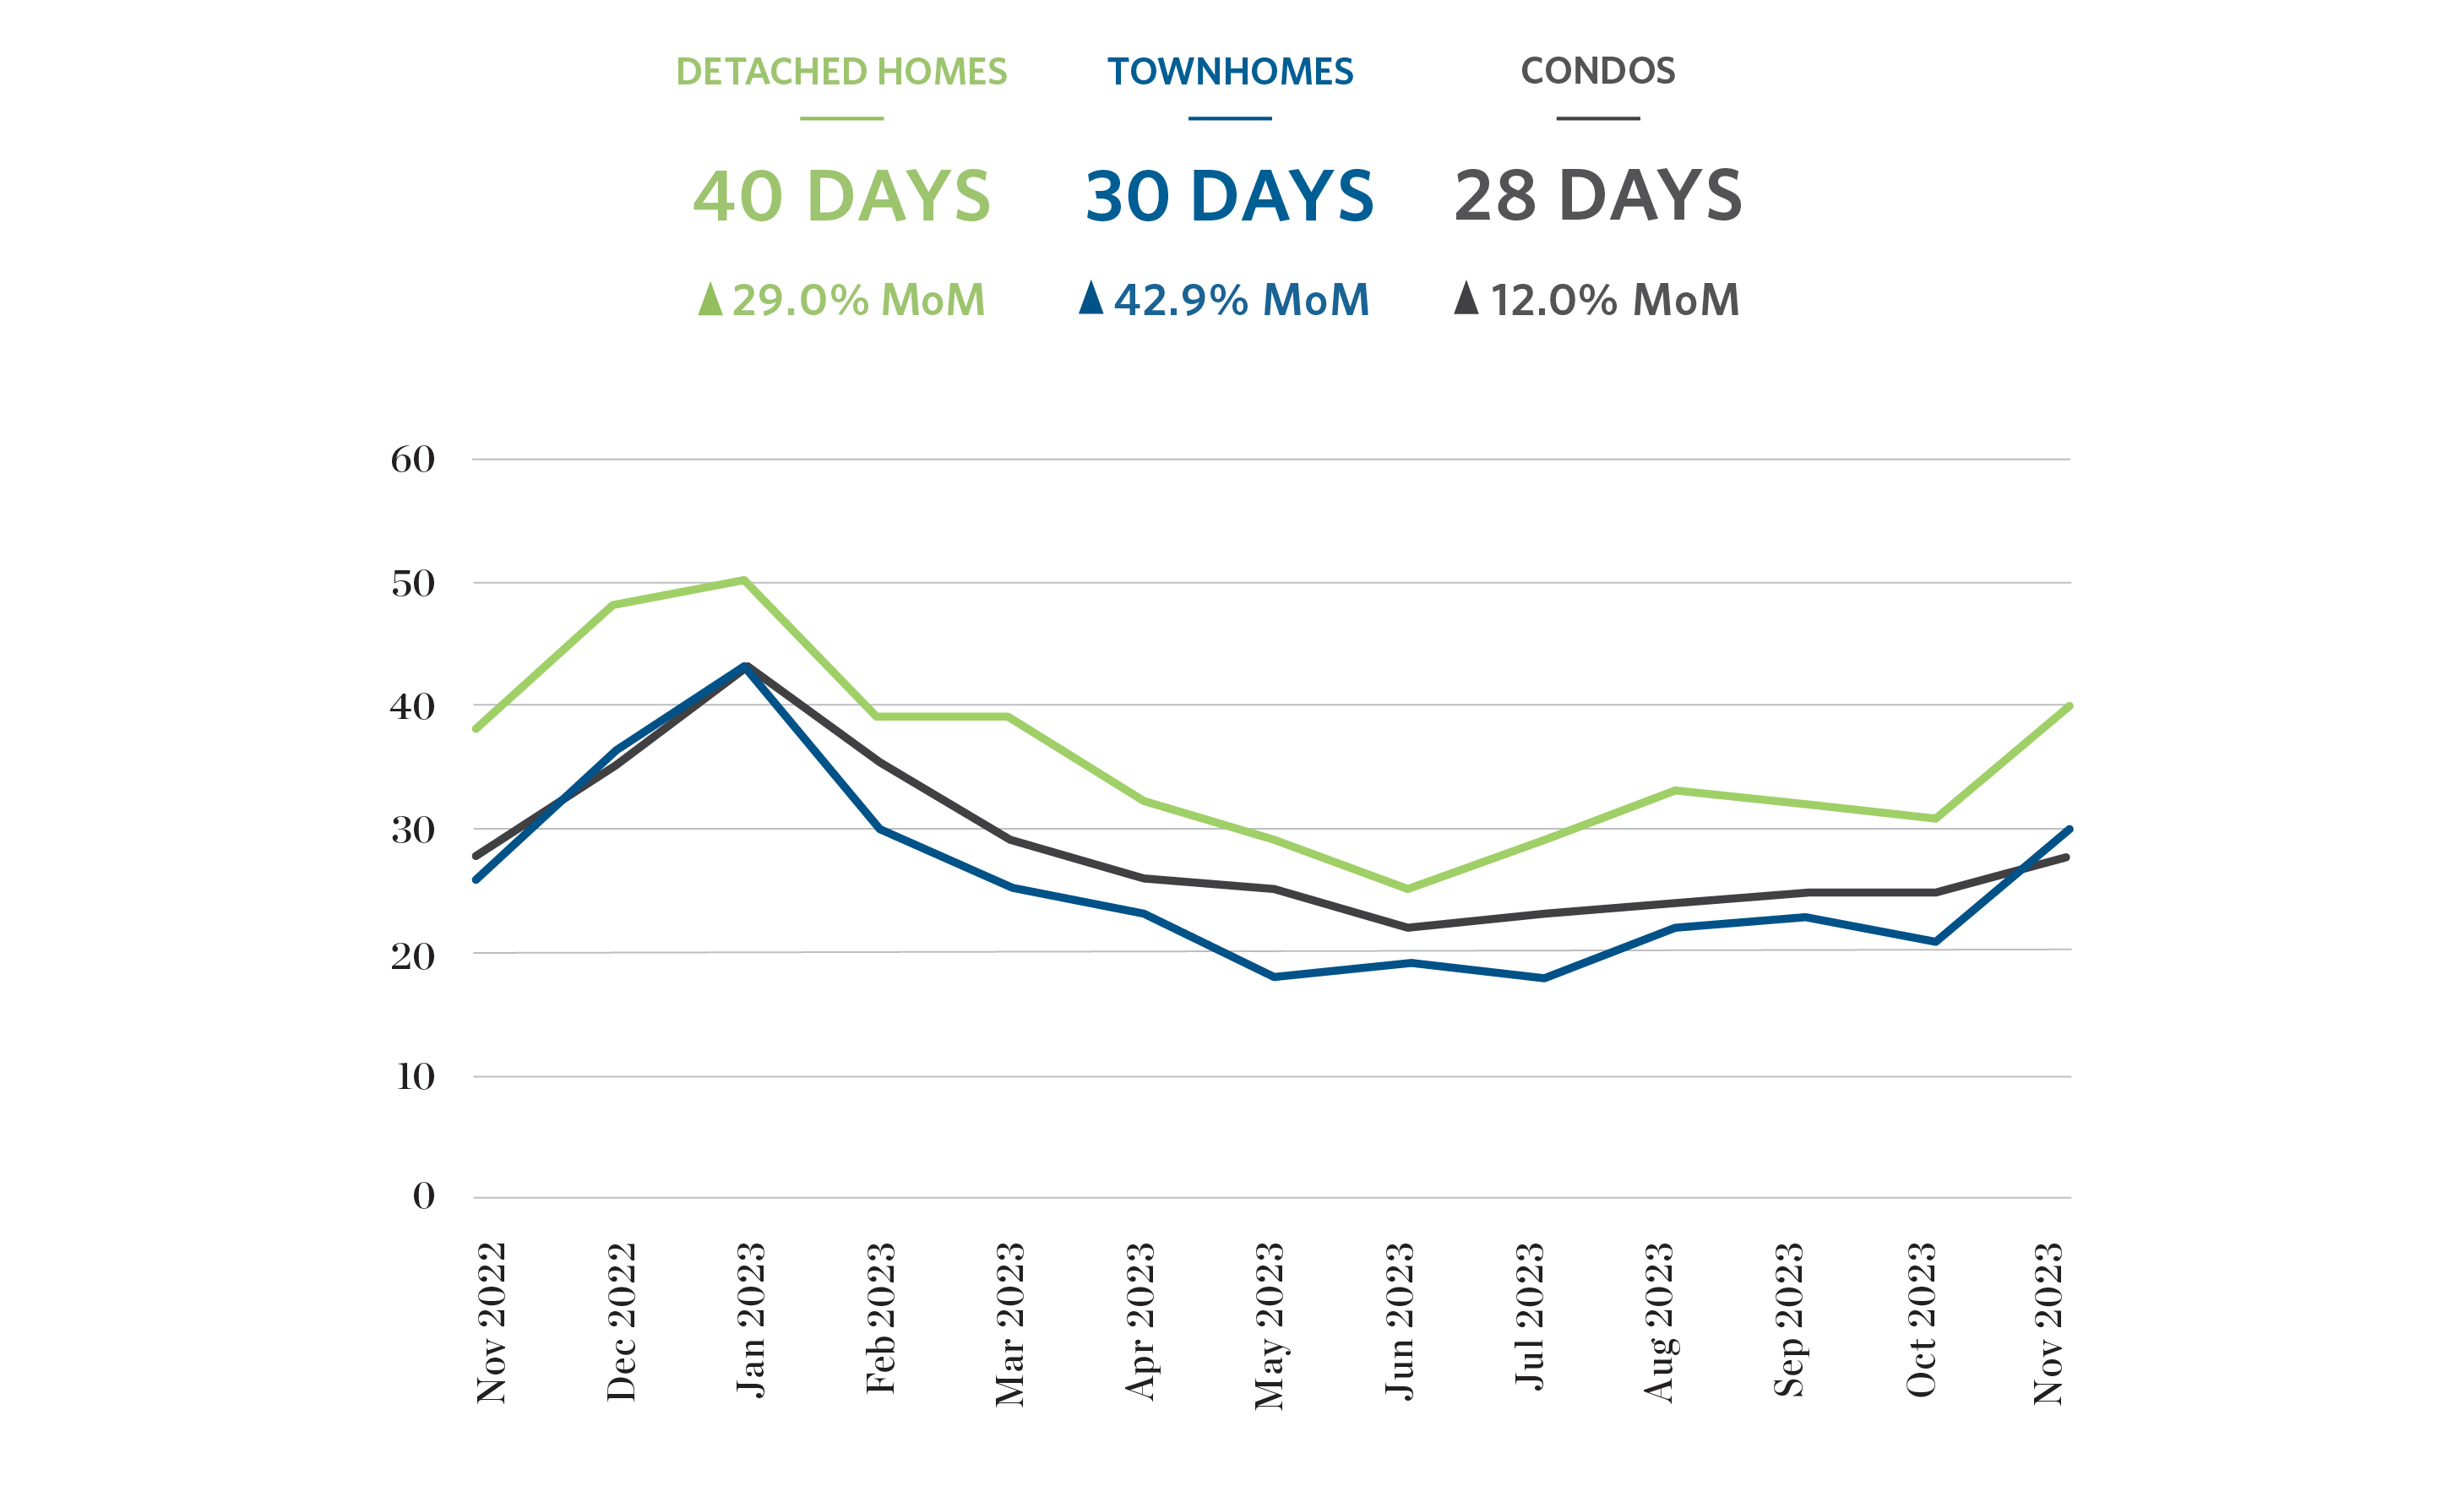
Days on Market
In November, all property types spent significantly more time on the market than the preceding month. Detached homes spend an average of 40 days on the market, while condos and townhomes move moderately faster, at 28 and 30 days respectively.
Featured Homes
Looking for a new home? Check out these featured new homes courtesy of our affiliate company, Breakside Real Estate Group.

GREATER VANCOUVER RESIDENTIAL REAL ESTATE: november 2023 statistics in infographics
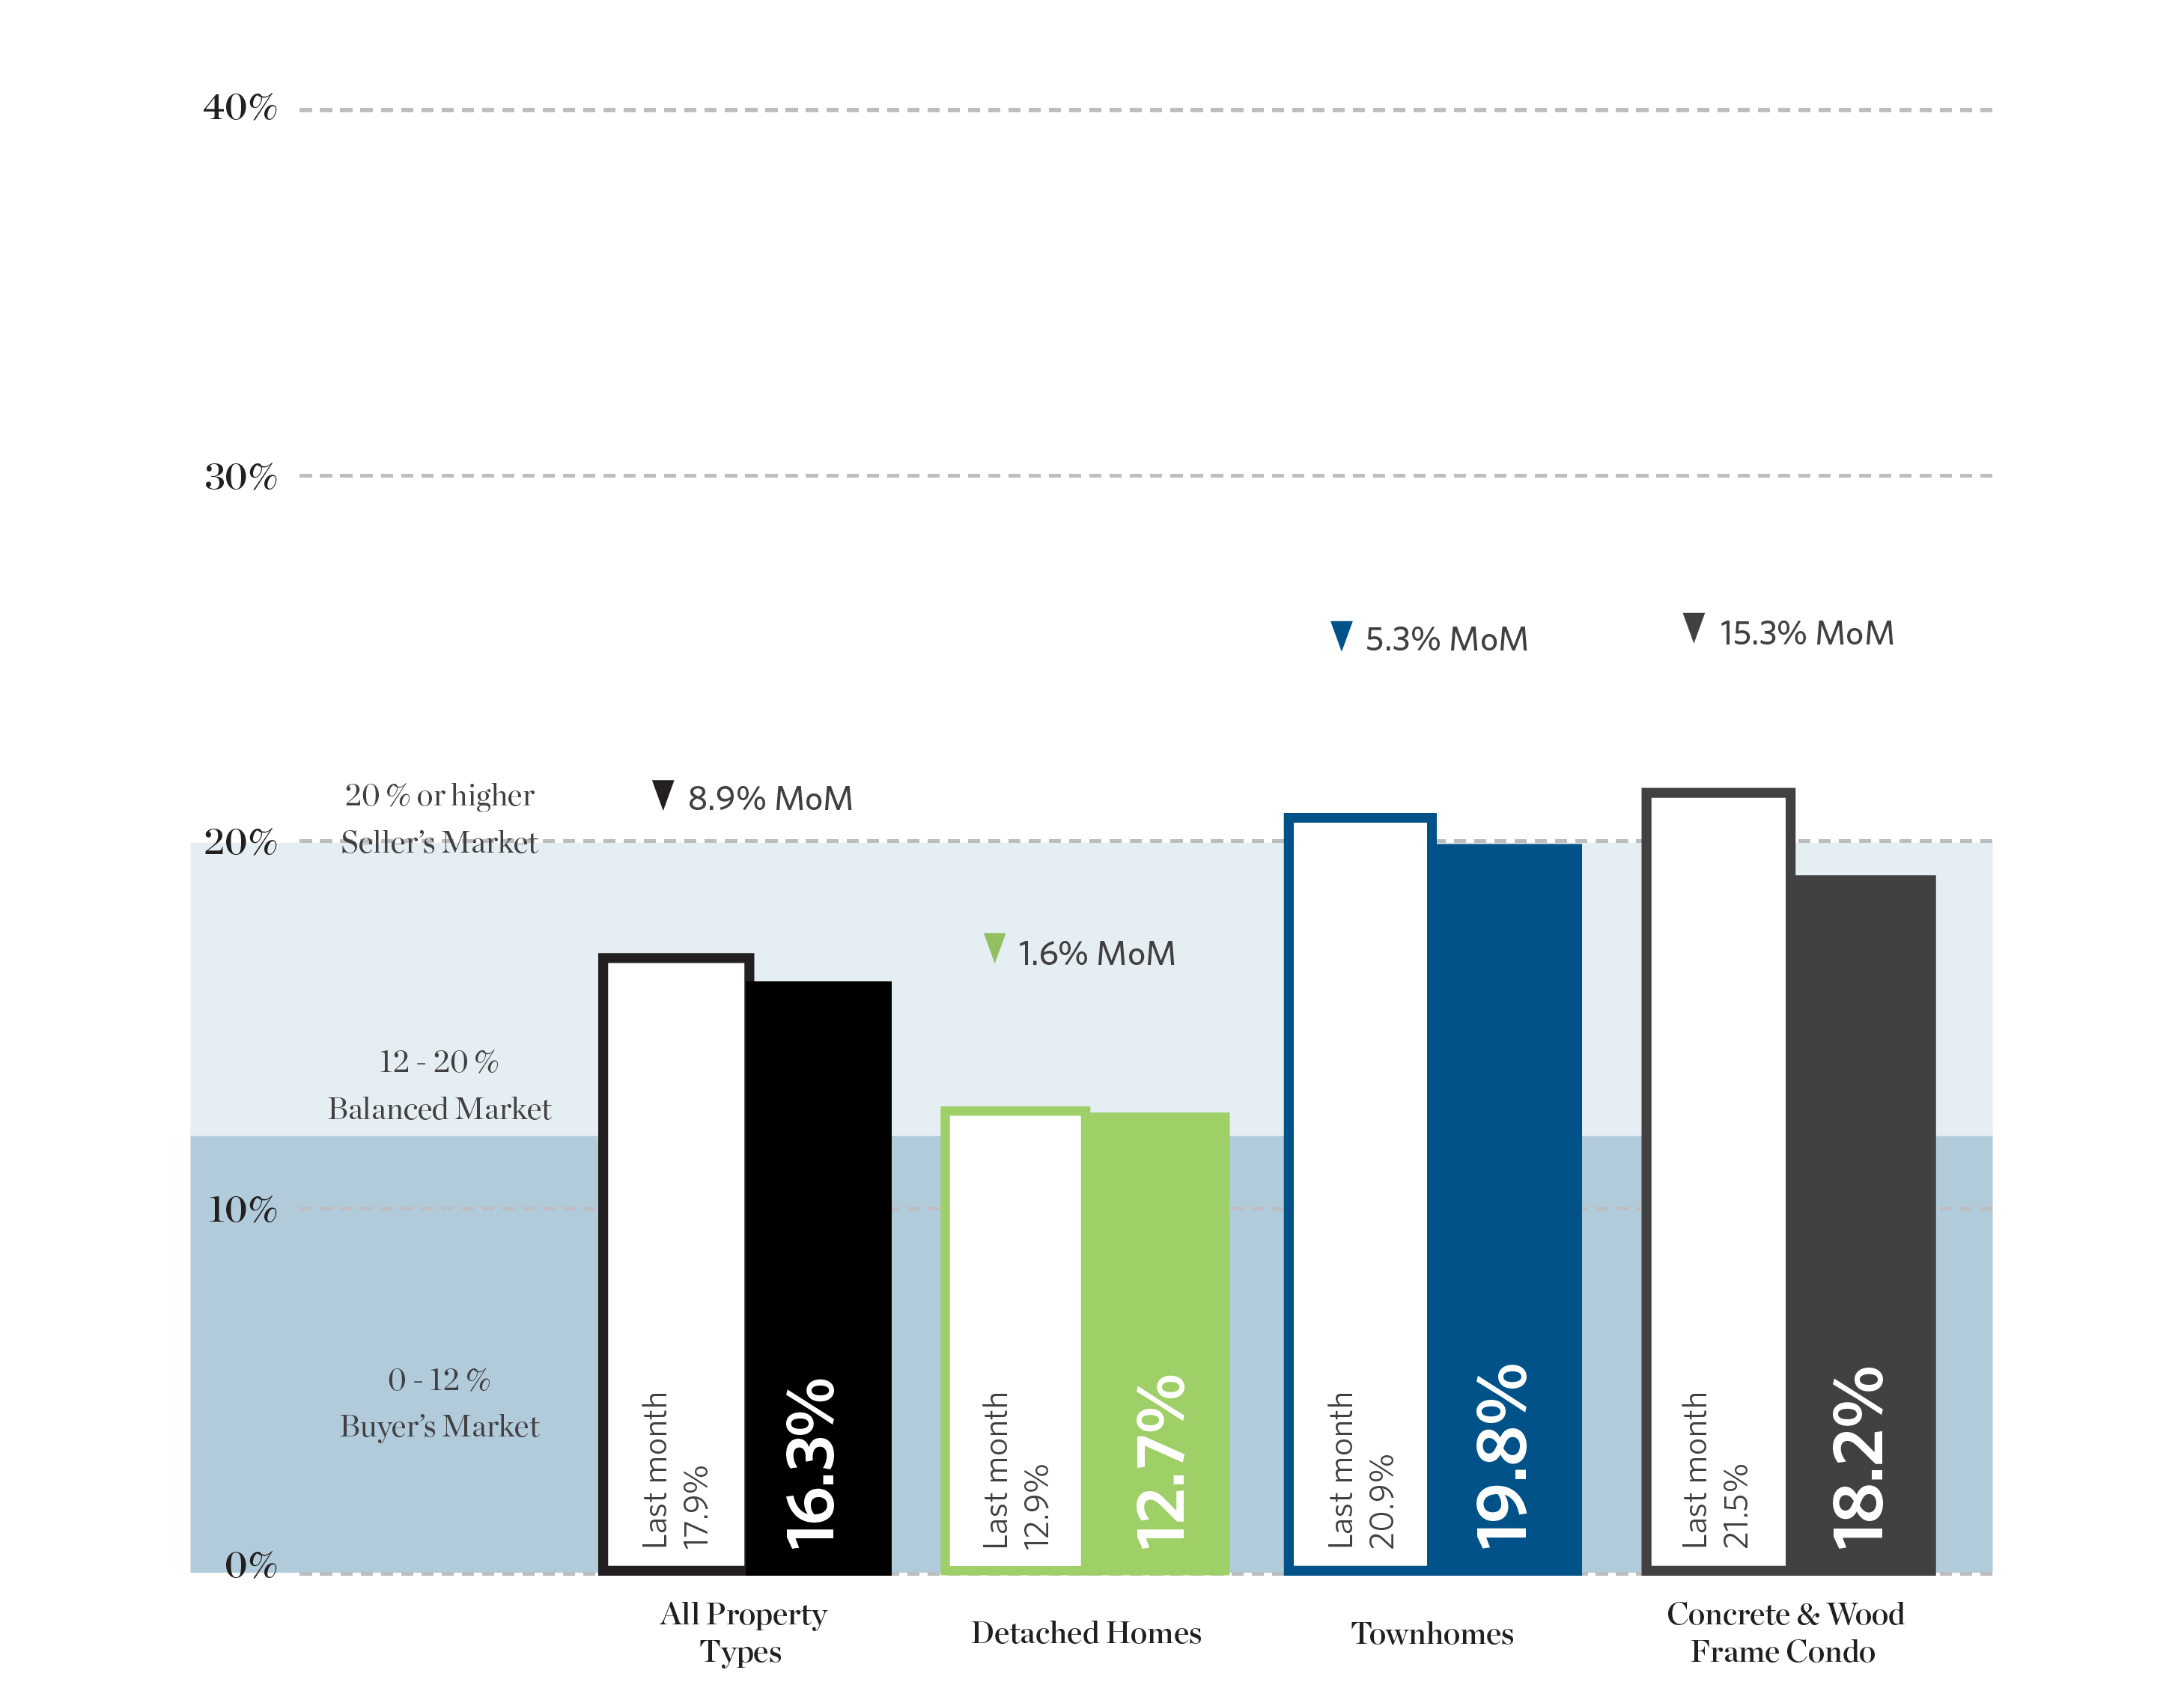
Sales To Active Listings Ratio
The sales-to-active listings ratio for all property types in Metro Vancouver saw decreases across all property types when compared to October, with an overall decrease of 8.9%. The ratio for condos experienced the greatest change, decreasing by 15.3% of a ratio of 18.2%, a result of a marked decrease in the number of sales compared to the number of active listings.
HPI Benchmark Prices
The Home Price Index (HPI) measures the price of a benchmark, or typical, property in a given market and is not influenced by the change in composition of properties sold, which can fluctuate quite significantly from month to month. As a result, this metric is a more pure and stable representation of market price change than average or median prices.
The gradual reduction in the HPI price for detached homes continues for the third consecutive month, decreasing 0.9% from October. The benchmark prices for townhomes and condos saw marginal decreases of 0.7% and 1% repectively. Benchmark prices across all property types in Metro Vancouver continue to experience increases when compared to the same period in the previous year.
Sales • New Listings • Active Listings
The sales-to-active listings ratio helps gauge the market’s balance: high ratios indicate a seller’s market, while low ratios suggest a buyer’s market. The interplay between new listings and active listings affects overall inventory and provides insights for buyers and sellers to make informed decisions.
Further Reading
View the Real Estate Board of Greater Vancouver’s entire stats package for November 2023 here.
Please note: areas covered by the Real Estate Board of Greater Vancouver include: Whistler, Sunshine Coast, Squamish, West Vancouver, North Vancouver, Vancouver, Burnaby, New Westminster, Richmond, Port Moody, Port Coquitlam, Coquitlam, Pitt Meadows, Maple Ridge, and South Delta.
Sources
Sources: Breakside Real Estate Group, Real Estate Board of Greater Vancouver
This representation is based in whole or in part on data generated by the Real Estate Board of Greater Vancouver which assumes no responsibility for its accuracy.
