Infographic: Greater Vancouver Residential Real Estate September 2023
In September, the housing market in Metro Vancouver witnessed a slight downward trend in home prices for all property types, as well as a reduction in the number of sales. This slow-down in sales is typical of the cyclical nature of real estate, where sales tend to ebb in the late summer and early autumn.
These residential market statistics from the Real Estate Board of Greater Vancouver provide insight into the current state of the residential home market, including home values, which directly impact the development land market. Contact us today if you would like to learn what your property is worth on the development land market.
KEY TAKEAWAYS FROM SEPTEMBER 2023 GREATER VANCOUVER RESIDENTIAL MARKET
- Despite a reduction in the month-over-month sales, detached homes saw a 10.6% increase when compared to September of 2022.
- The number of active listings across all property types saw an increase in both the month-over-month and year-over-year comparisons, indicating an increase in the available inventory and sellers’ willingness to participate in the market.
- The Home Price Index composite benchmark price for all properties increased an average of 5.3% compared to September of 2022, though all property types experienced a reduction when compared to August of 2023.
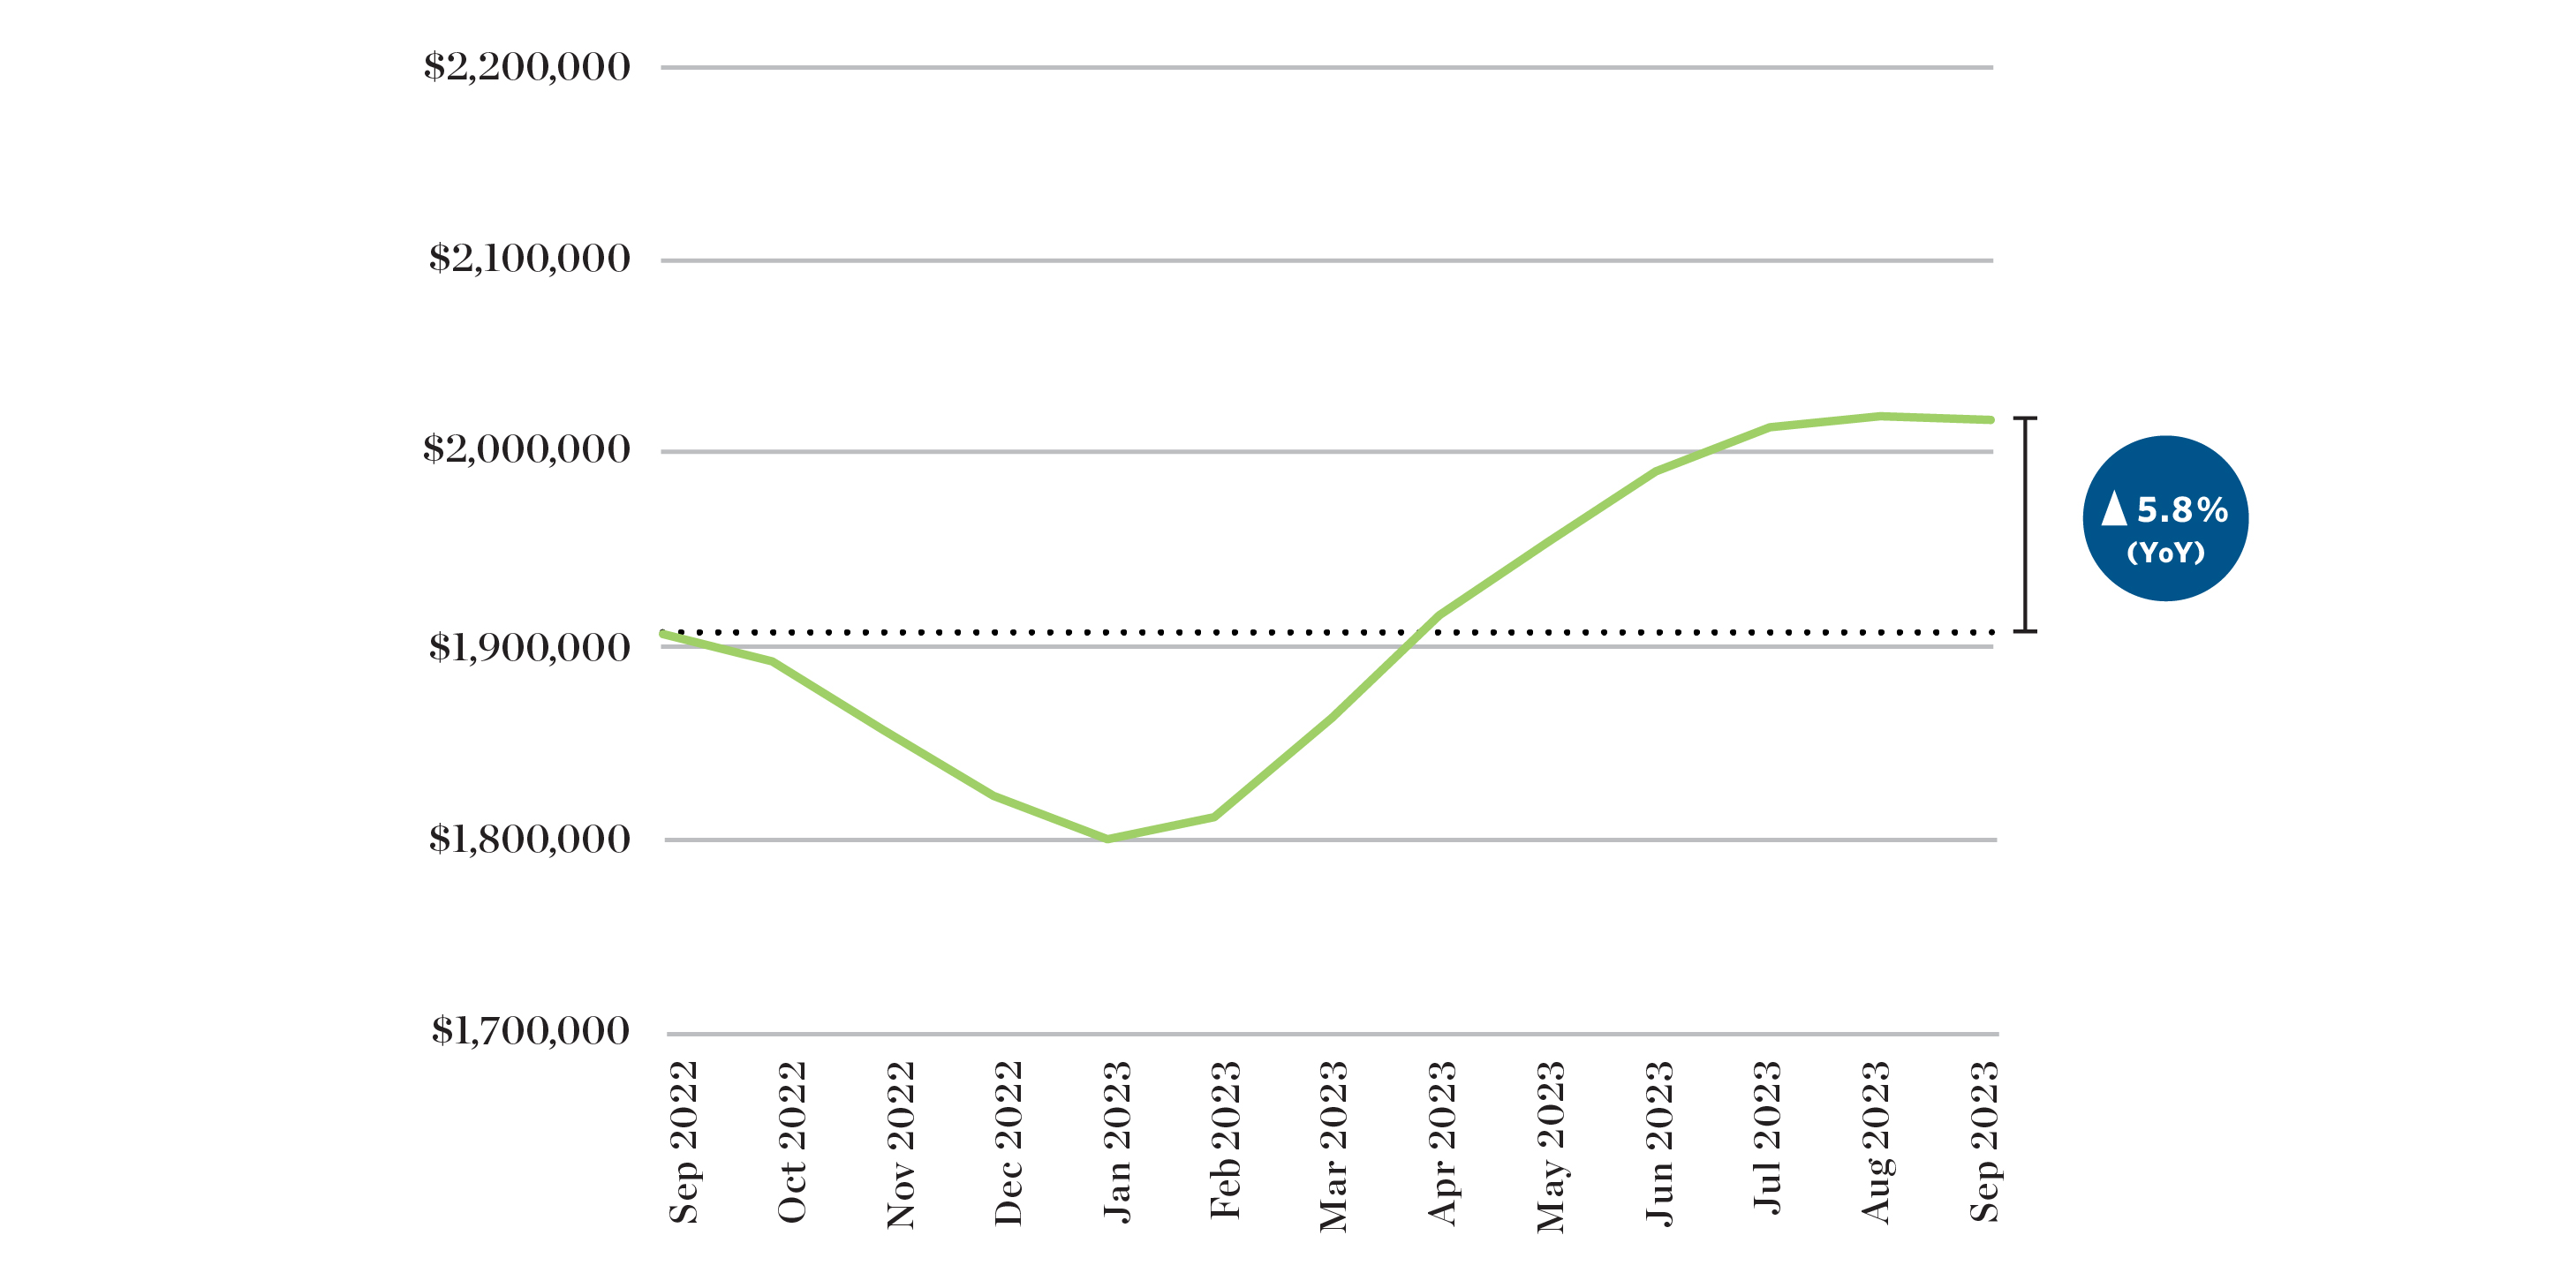
HPI Benchmark Price of Detached Homes
The gradual increase in the HPI benchmark price for detached homes appears to have come to an end as detached homes experienced the first decrease since January of this year. Despite this reduction, the year-over-year comparison indicates growth of 5.8% when compared to the same month in 2022.
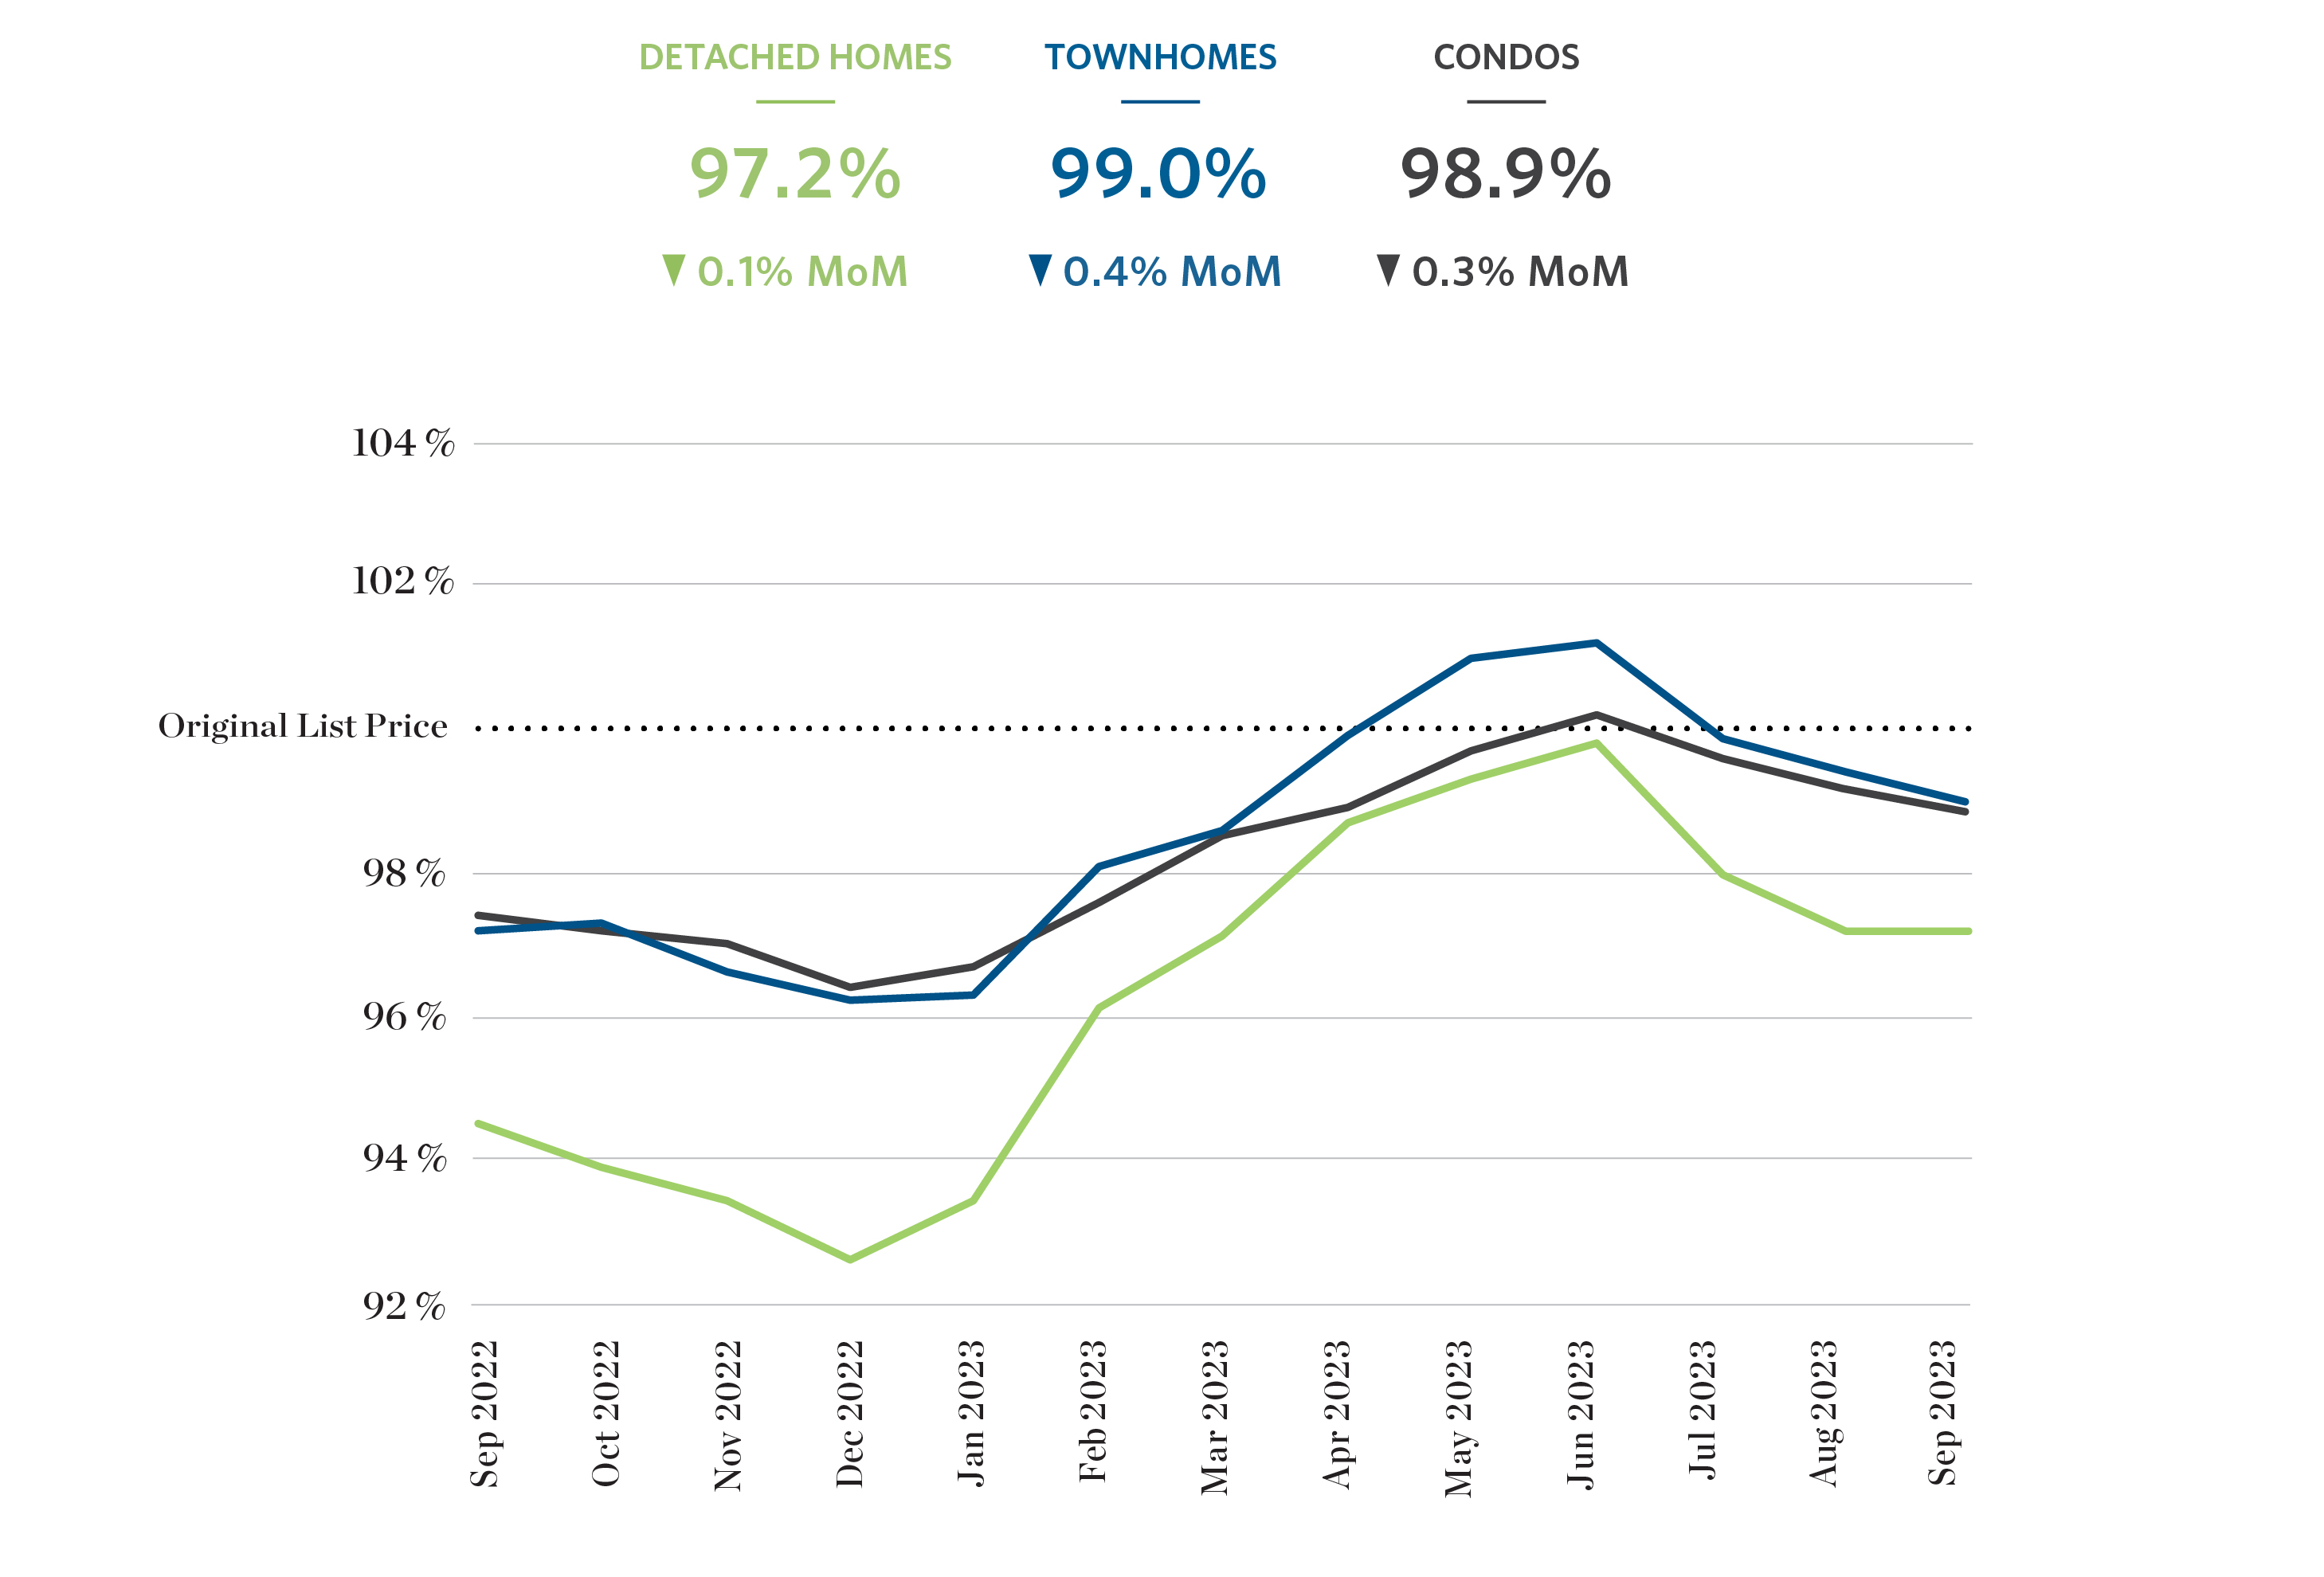
Sale Price As a Percent of Original List Price
The average sale price as a percentage of original list price decreased slightly from their original list prices between August 2023 and September 2023. However, it’s important to note that these percentages can fluctuate based on various factors such as market conditions, supply and demand dynamics, and individual property characteristics.
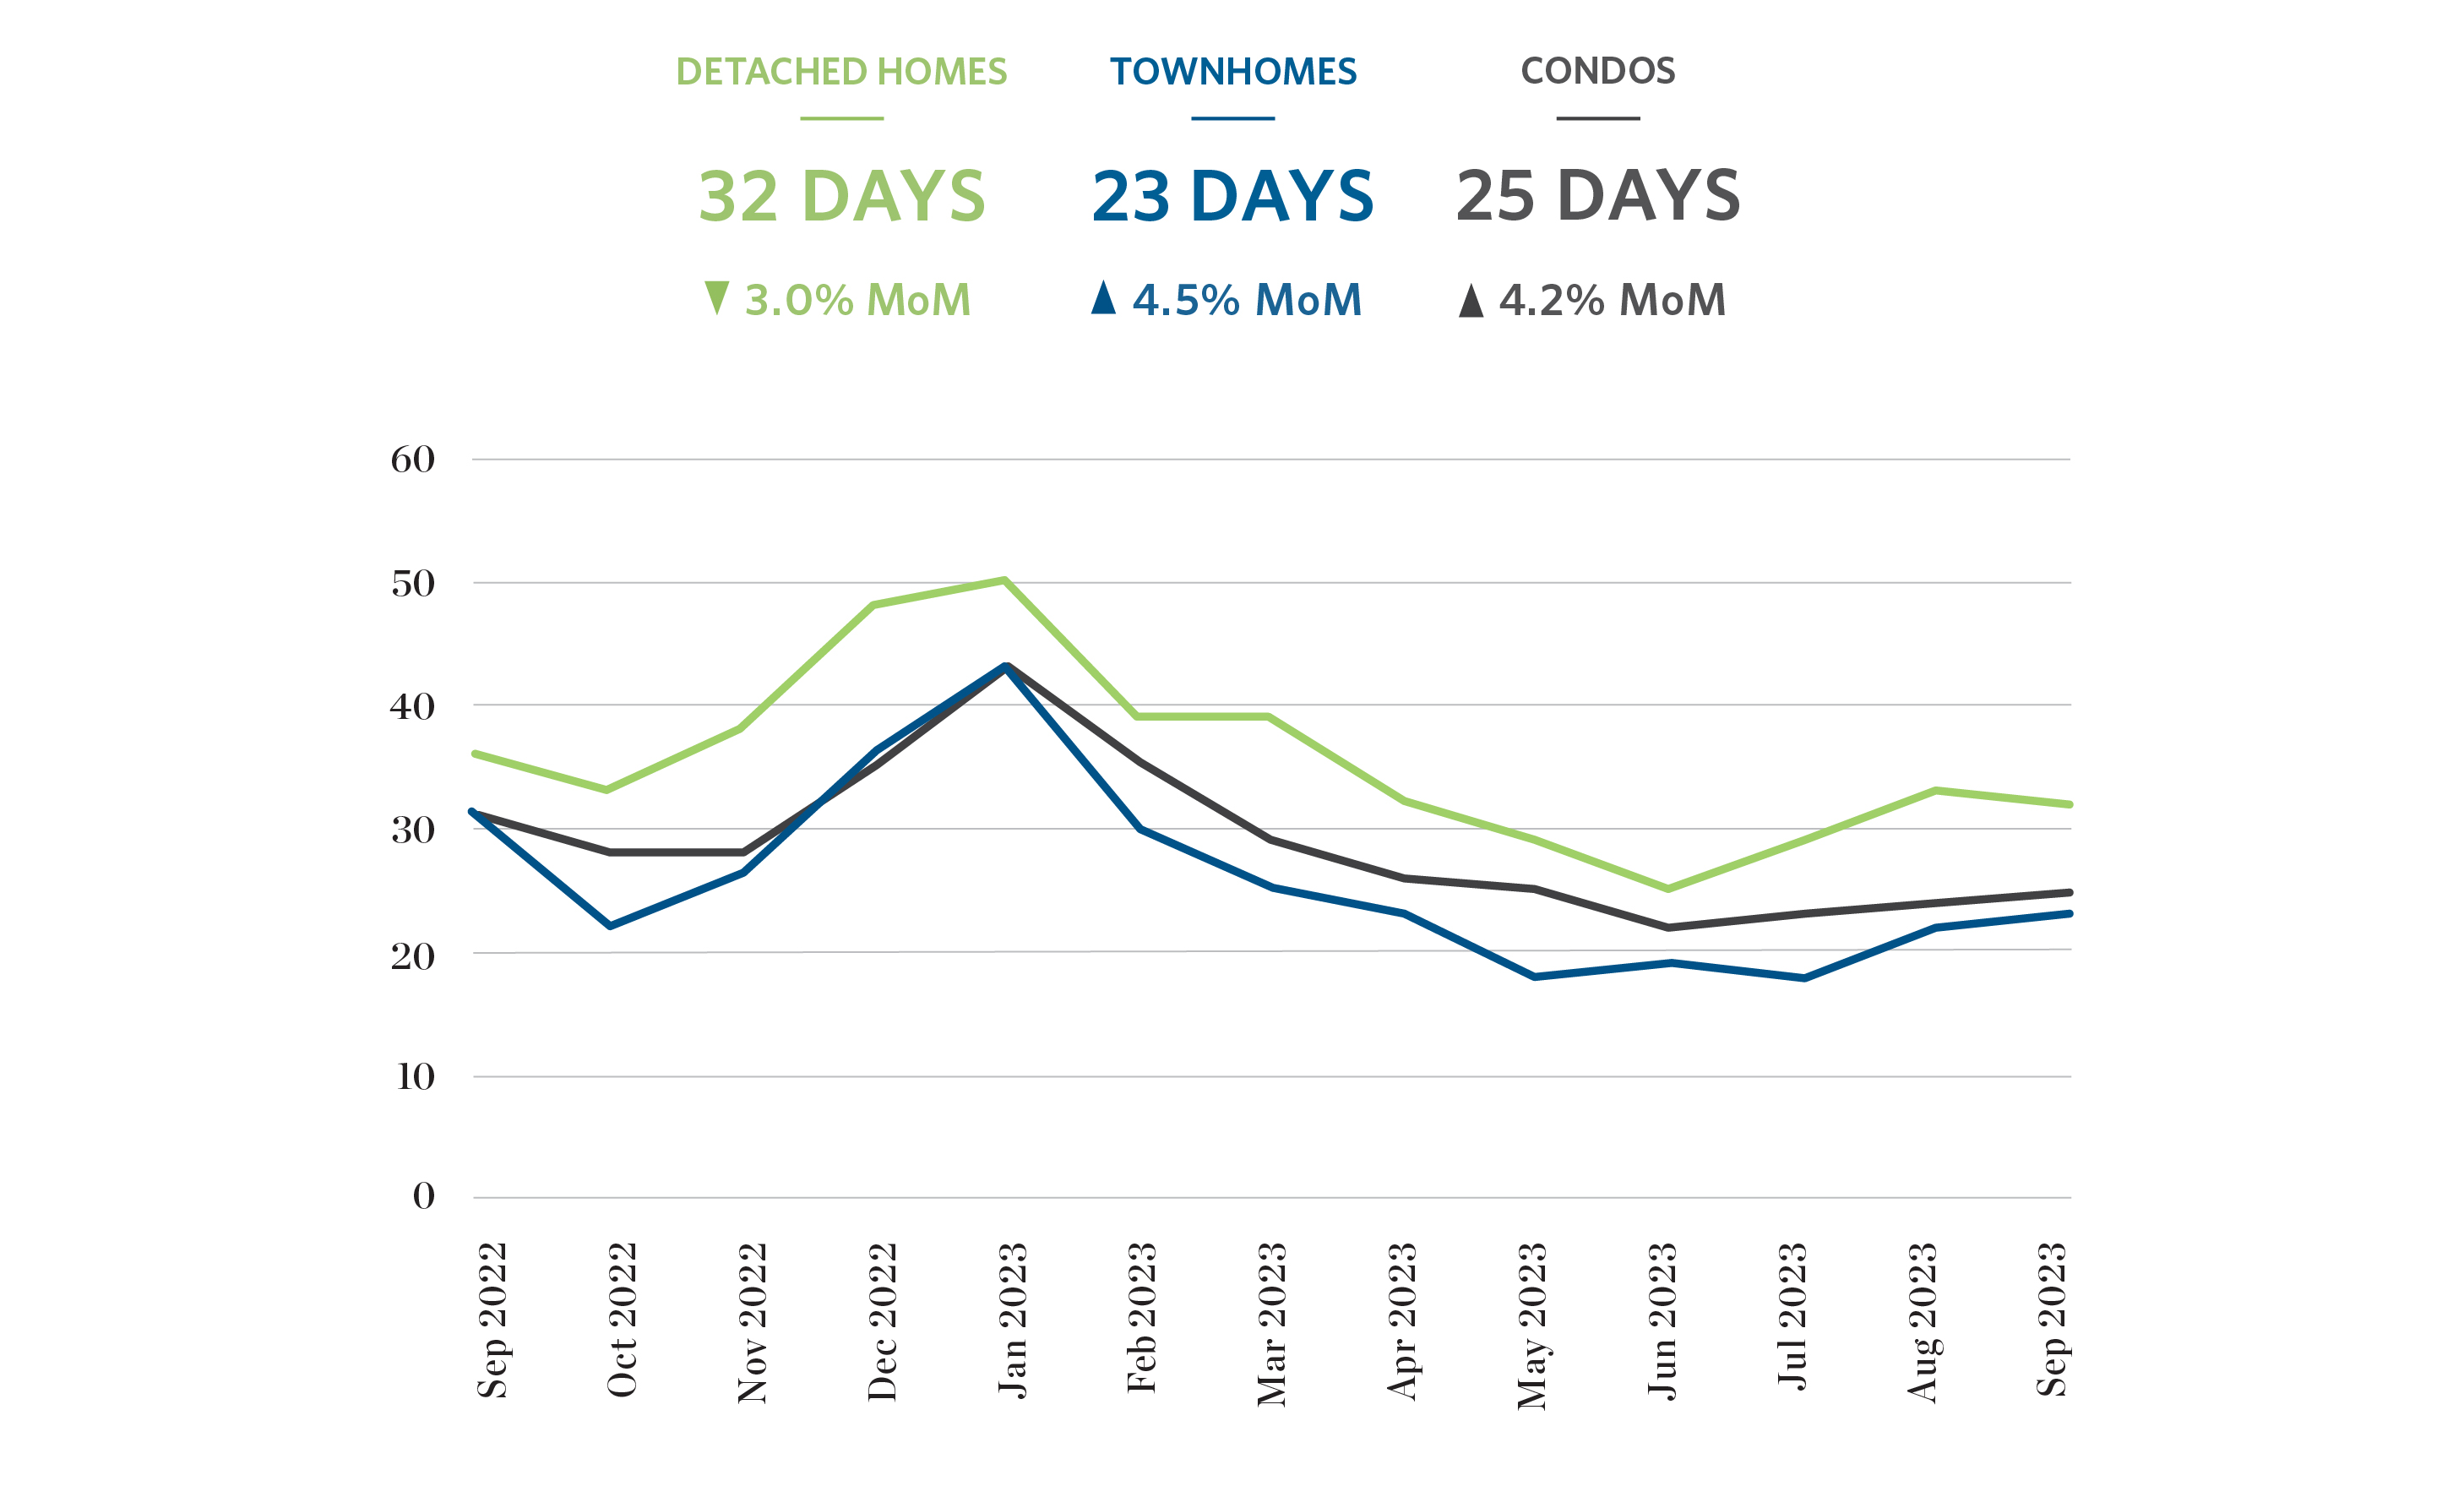
Days on Market
In September, townhouses and condos spent longer on the market at an average of 24 days, while detached homes appear to moving slightly faster, at 32 days on the market compared to 33 days in August.
Featured Homes
Looking for a new home? Check out these featured new homes courtesy of our affiliate company, Breakside Real Estate Group.

GREATER VANCOUVER RESIDENTIAL REAL ESTATE: SEPTEMBER 2023 statistics in infographics
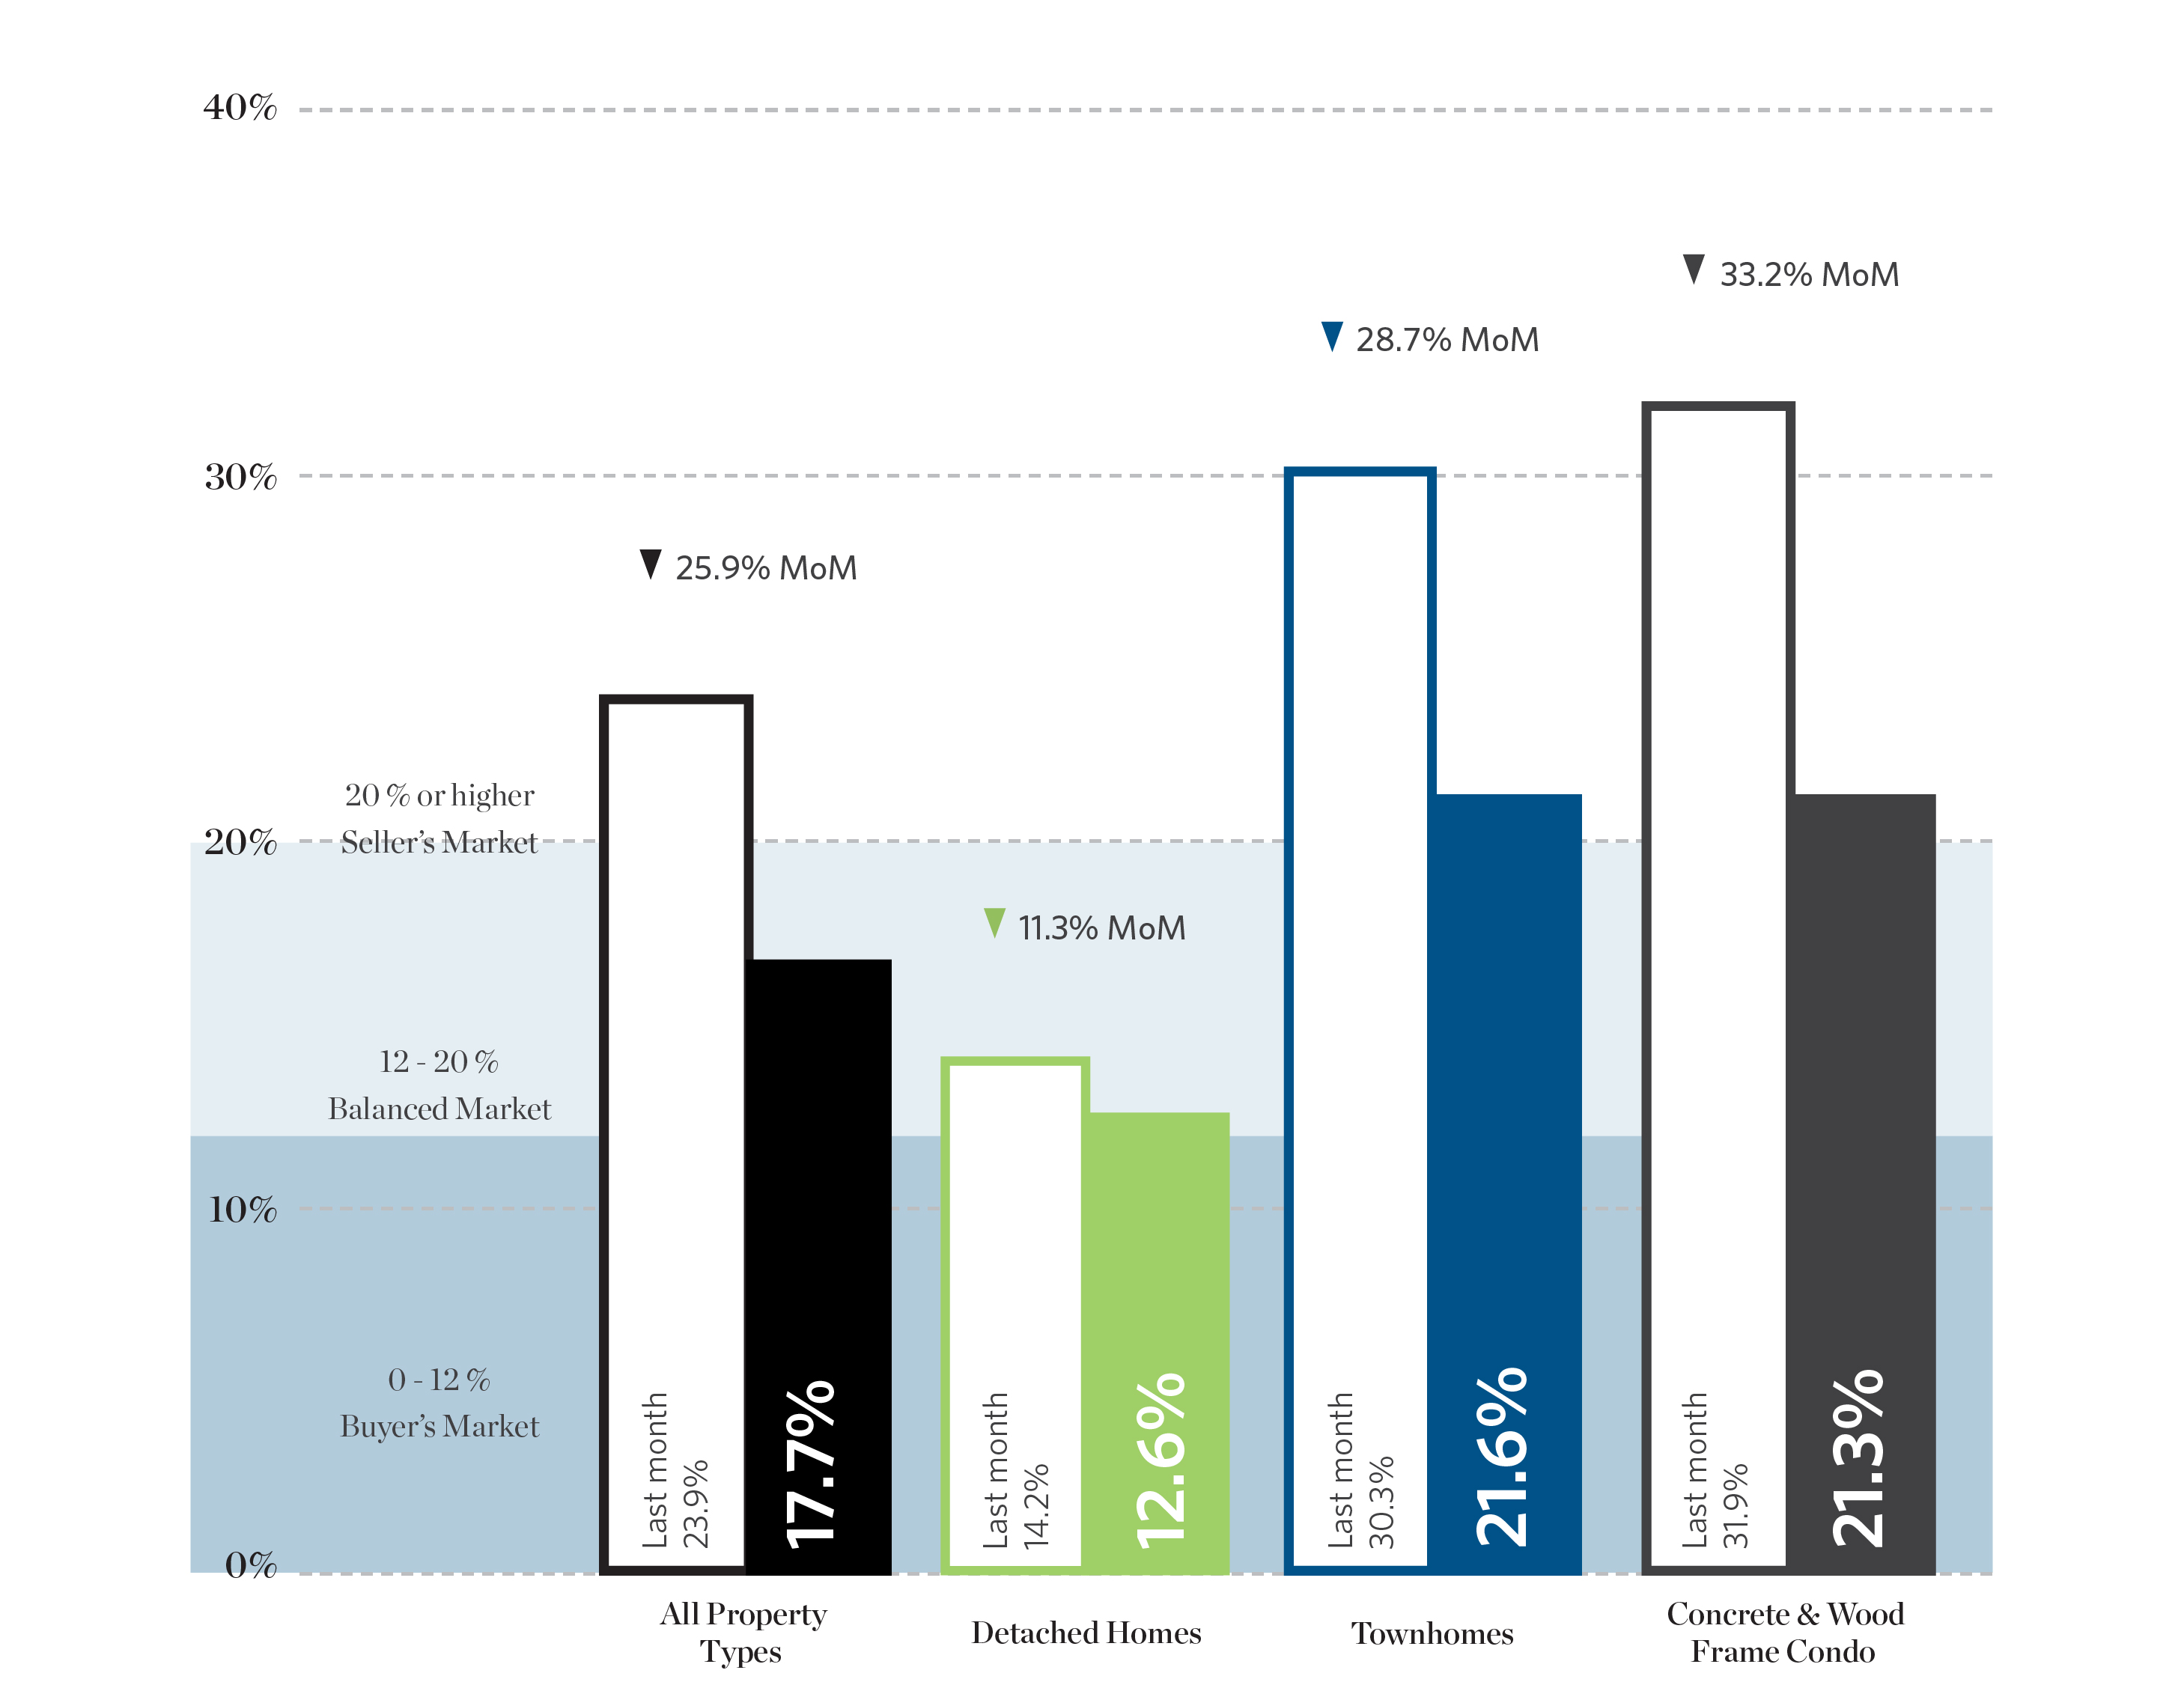
Sales To Active Listings Ratio
The sales-to-active listings ratio for all property types in Metro Vancouver declined further in September 2023 compared to August 2023. Townhomes and condos saw the greatest shift in the ratio, an average decrease of 21.5%, a result of fewer sales and an increase in the number of listings. This decline indicates a trend towards a balanced market.
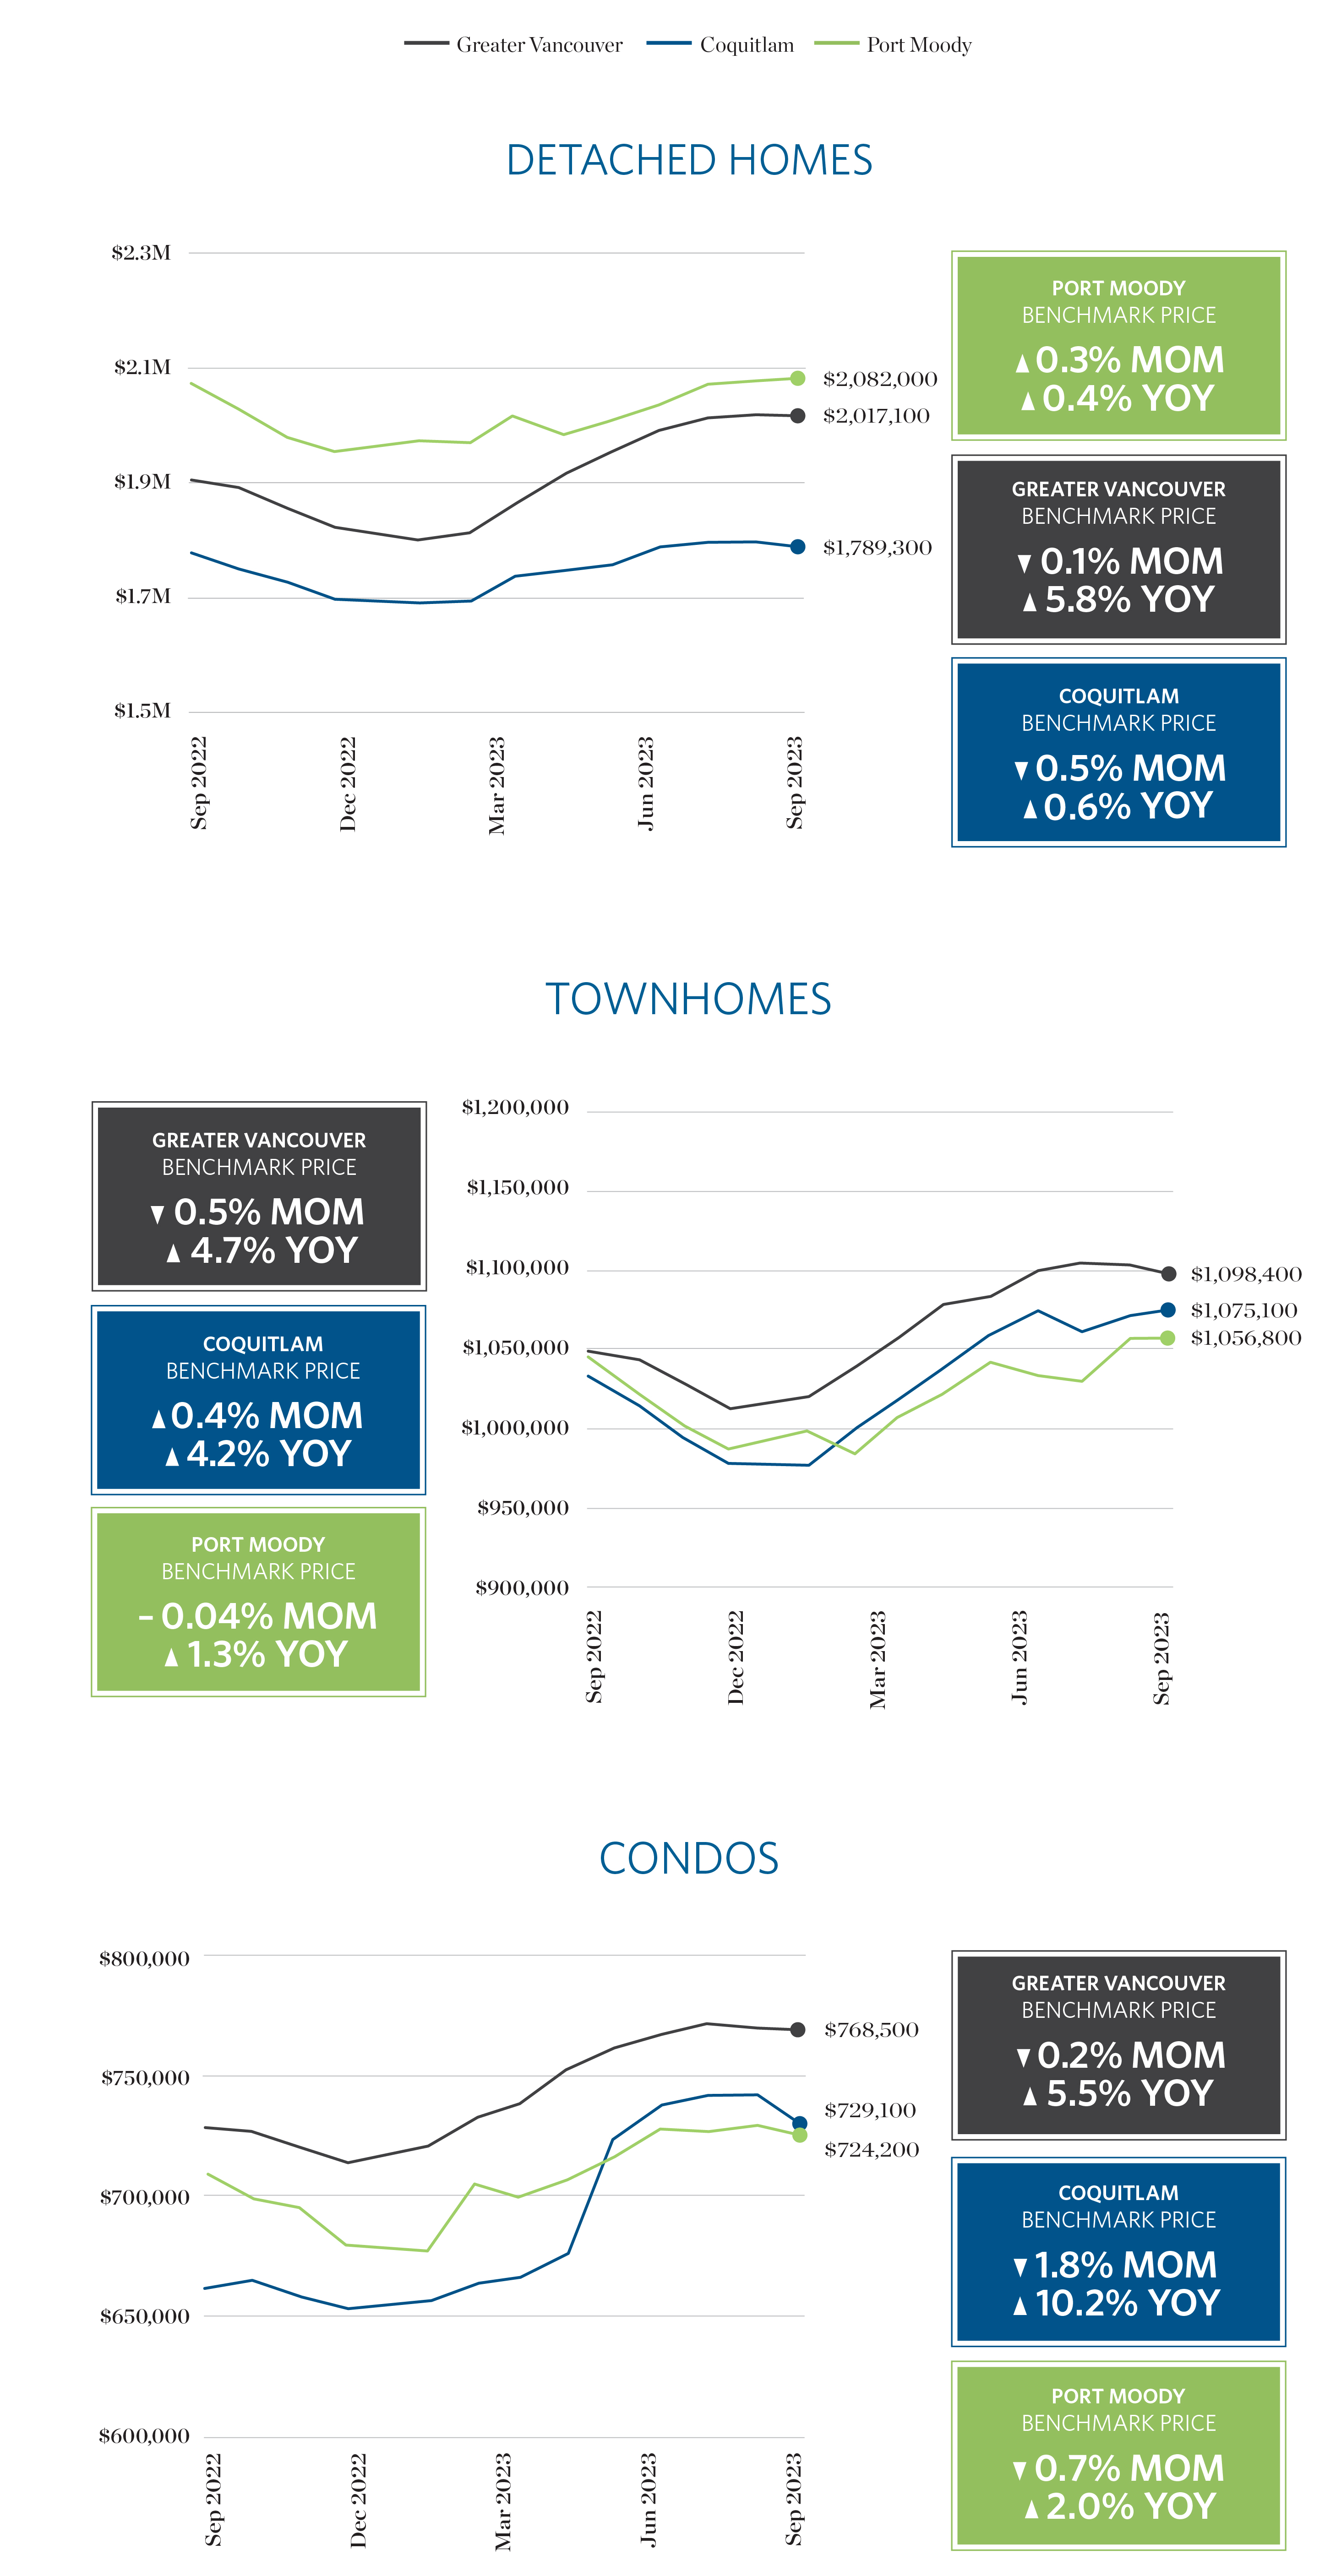
HPI Benchmark Prices
The Home Price Index (HPI) measures the price of a benchmark, or typical, property in a given market and is not influenced by the change in composition of properties sold, which can fluctuate quite significantly from month to month. As a result, this metric is a more pure and stable representation of market price change than average or median prices.
The upward trend for the benchmark price of detached homes appears to be at an end following steady increases since February of this year. The benchmark prices for townhomes and condos continue the marginal reduction seen in the previous month. Despite this, benchmark prices across all property types are steadily increasing year over year across Greater Vancouver.
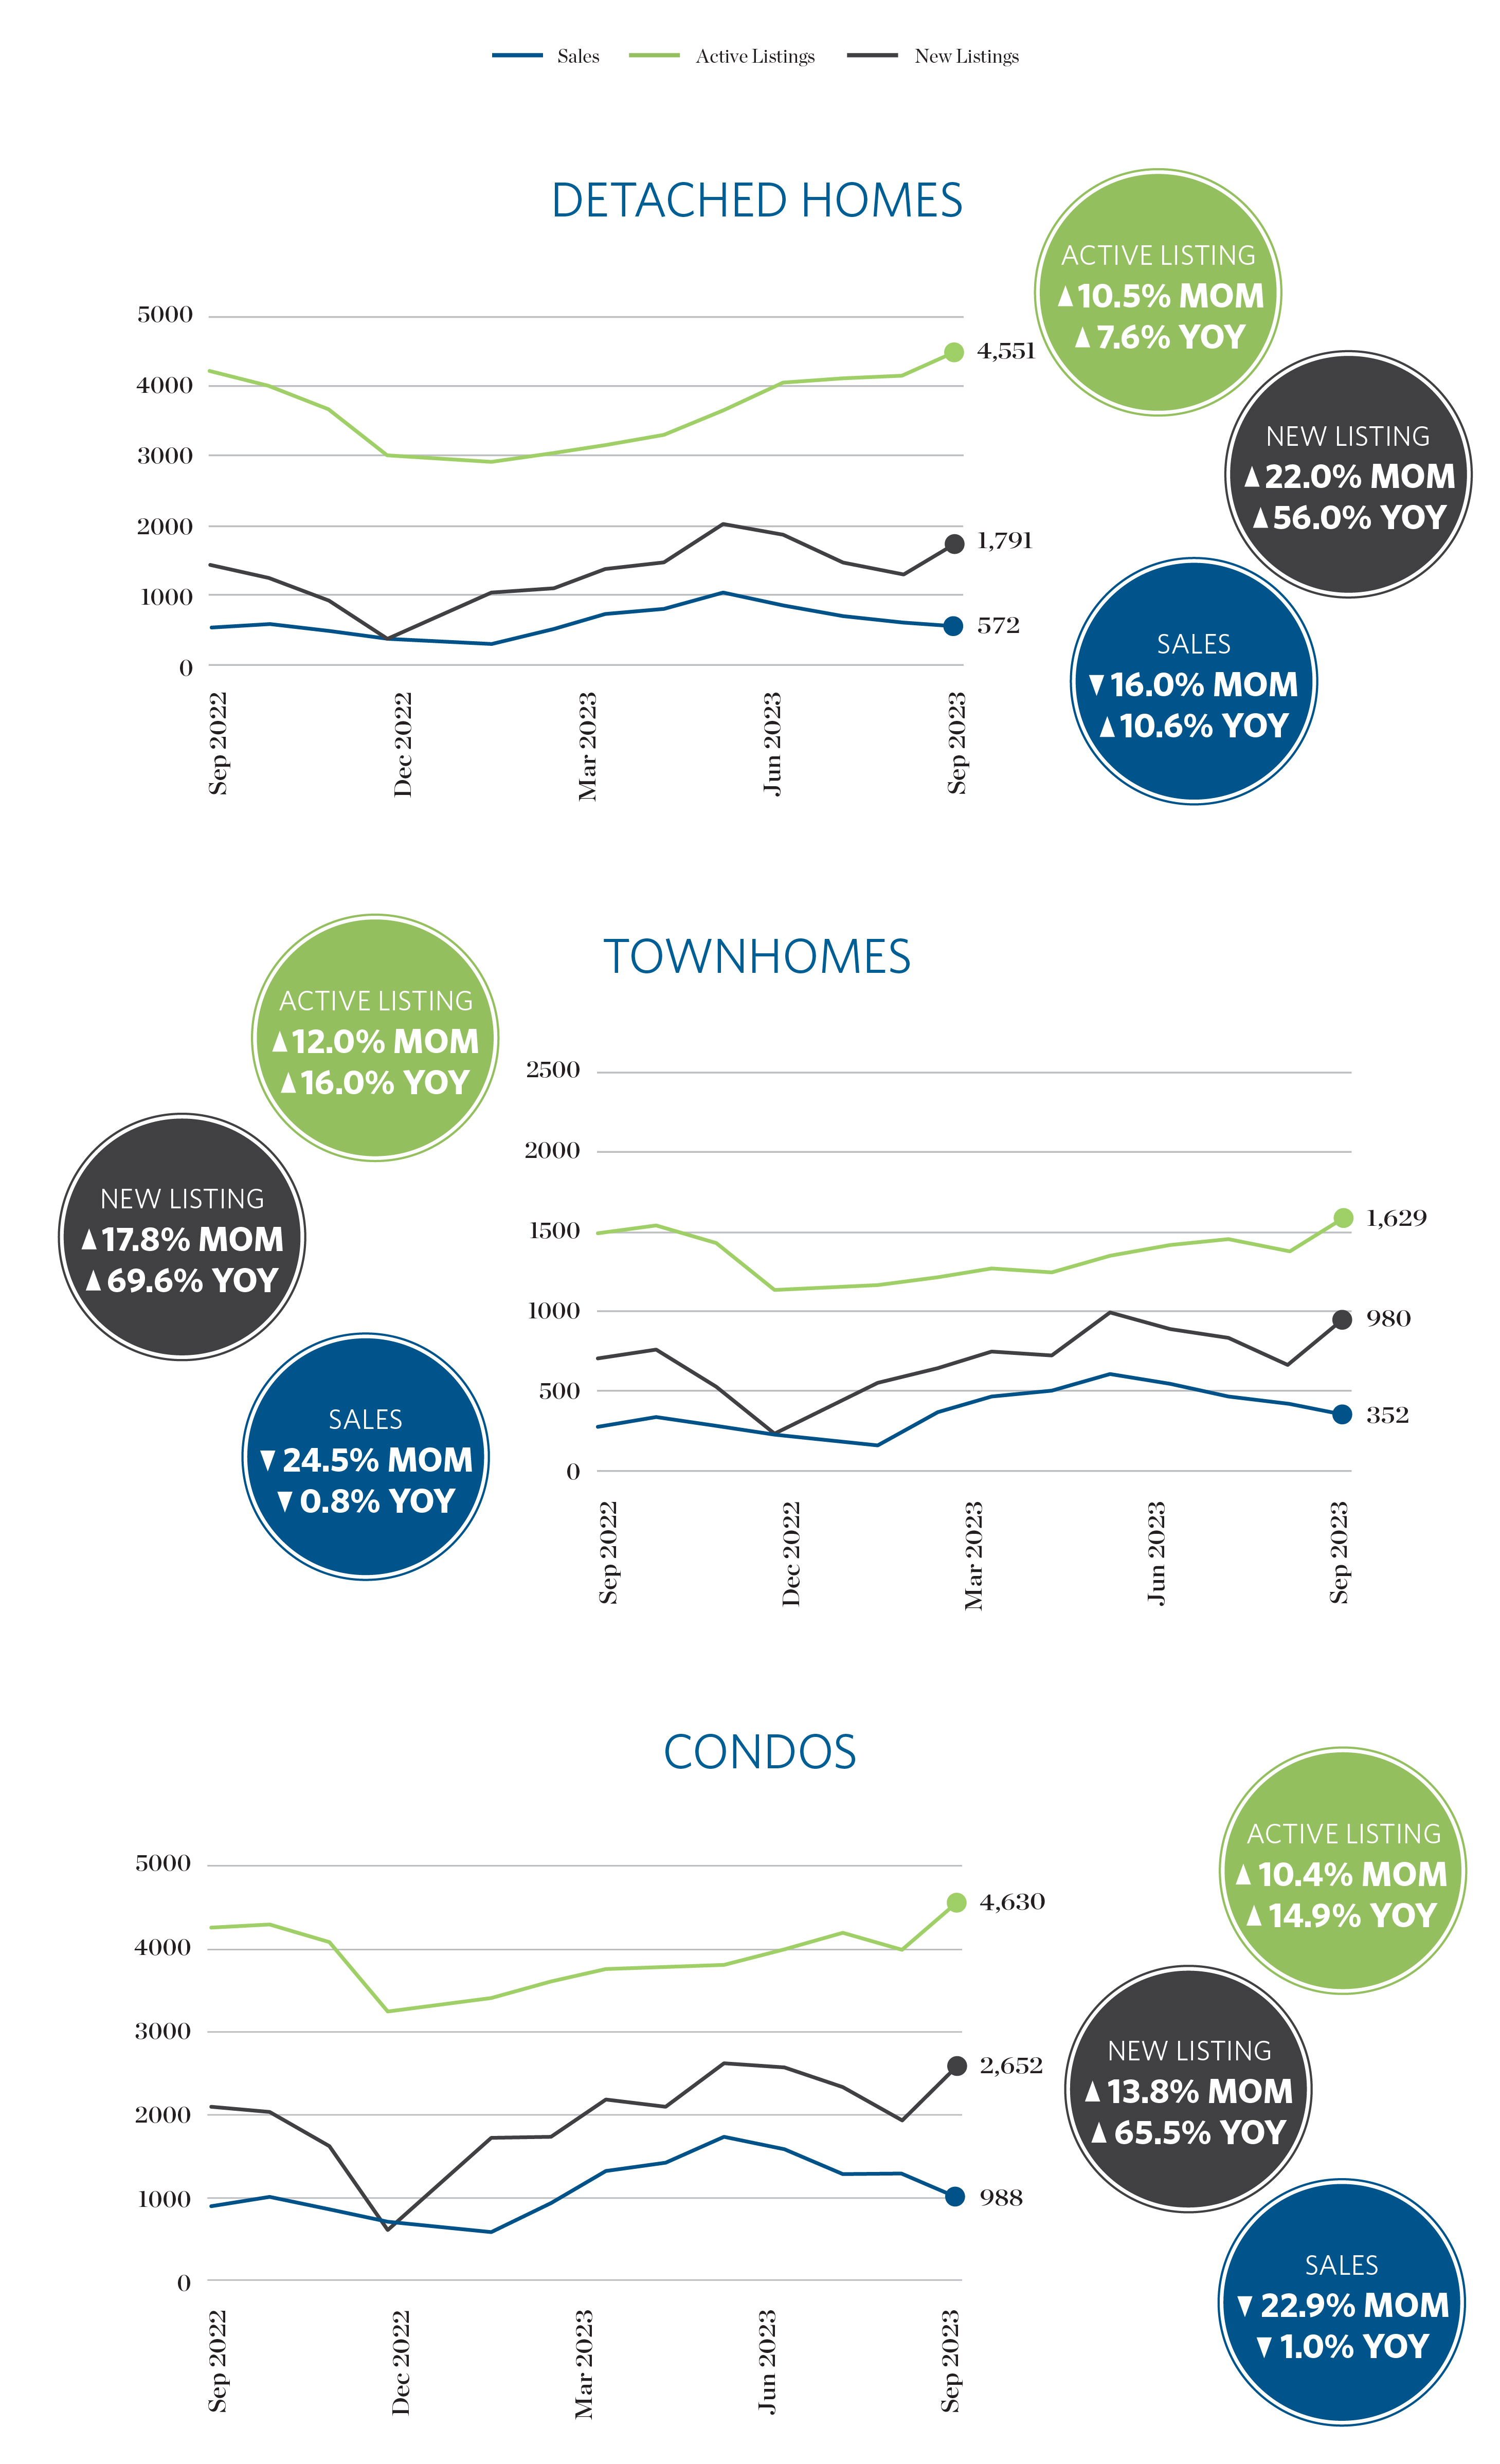
Sales • New Listings • Active Listings
The sales-to-active listings ratio helps gauge the market’s balance: high ratios indicate a seller’s market, while low ratios suggest a buyer’s market. The interplay between new listings and active listings affects overall inventory and provides insights for buyers and sellers to make informed decisions.
Further Reading
View the Real Estate Board of Greater Vancouver’s entire stats package for September 2023 here.
Please note: areas covered by the Real Estate Board of Greater Vancouver include: Whistler, Sunshine Coast, Squamish, West Vancouver, North Vancouver, Vancouver, Burnaby, New Westminster, Richmond, Port Moody, Port Coquitlam, Coquitlam, Pitt Meadows, Maple Ridge, and South Delta.
Sources
Sources: Breakside Real Estate Group, Real Estate Board of Greater Vancouver
This representation is based in whole or in part on data generated by the Real Estate Board of Greater Vancouver which assumes no responsibility for its accuracy.
