North of the Fraser Residential Real Estate: December 2018 Infographic
The final 2018 residential market stats are in and they underscore what was a year of transition for Greater Vancouver.
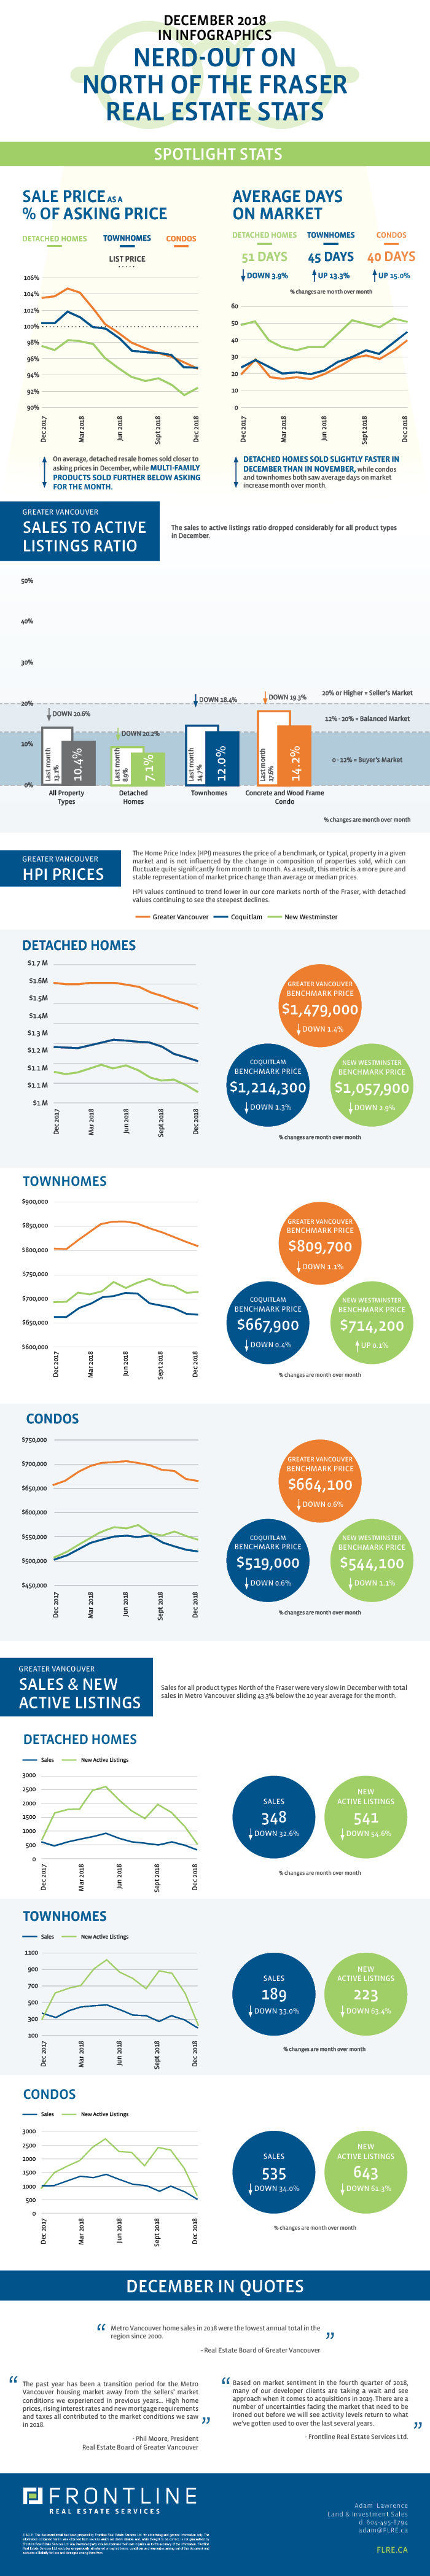
In 2018 residential MLS sales totalled 24,619 units which was a 31.6% decrease from 2017 and 25% below the 10 year annual sales average. Broken out by product type, year-over-year single family sales volume was down 34.0%, townhouse volume was down 31.5% and condo sales declined by 29.8%.
Benchmark pricing for multi-family product types in the region were up year-over-year, with townhomes seeing a 1.3% increase over December 2017 and condos seeing a 0.6% increase over December 2017. While the year-over-year price growth is positive, it’s important to note that benchmark prices for both condos and townhomes have seen six consecutive months of benchmark price decreases, ending the year nearly 6% below peak prices observed in June 2018.
This pattern can also be observed on a municipal level in our core markets of Coquitlam and New Westminster. In Coquitlam, condo prices were up 3.2% year-over-year but down 6.1% from peak pricing observed in August 2018. Townhomes were up 0.7% year-over-year but down 6.2% from peak pricing observed in June 2018. In New Westminster, benchmark prices for condos were up 7.4% year-over-year but down 5.1% from the peak observed in July 2018. Townhouses in New West were up 3.0% year over year but down 3.7% from the peak pricing observed in August 2018.
Comparably, benchmark prices for single family homes across Greater Vancouver were down 7.8% year-over-year. Coquitlam faired slightly better but still saw prices decrease by 5.3% while single family homes in New West saw their benchmark values decrease by 8.8% over the course of 2018.
What does this mean for development land in Greater Vancouver? The development land market has shifted across Metro Vancouver and prices for development land have undoubtedly started to flatten out or decline in our core markets north of the Fraser. Efficient, well-located multi-family development sites are still of considerable interest to our clients, however competition and urgency has waned and offer prices are not where they were this time last year. In addition, buyer expectations for both due diligence and closing timelines have increased considerably.
In our core markets north of the Fraser, the overall availability of development sites has also increased over the last 6 months and, as such, our developer clients are reacting with less urgency towards potential acquisitions. Heading into 2019, vendors need to ensure that new development land opportunities are priced correctly and thoughtfully marketed in order to achieve success in what is undoubtedly a more challenging market than has been observed over the last 18 – 24 months.
Please note: areas covered by the Real Estate Board of Greater Vancouver include: Whistler, Sunshine Coast, Squamish, West Vancouver, North Vancouver, Vancouver, Burnaby, New Westminster, Richmond, Port Moody, Port Coquitlam, Coquitlam, Pitt Meadows, Maple Ridge, and South Delta.
View the Real Estate Board of Greater Vancouver’s entire stats package for December 2018 here.
This representation is based in whole or in part on data generated by the Real Estate Board of Greater Vancouver which assume no responsibility for its accuracy.
