North of the Fraser Residential Real Estate: July 2019 Infographic
The July housing market stats are in from the Real Estate Board of Greater Vancouver and while prices are down, the unexpected increase in sales activity across all product types is providing some cautious optimism in the market.
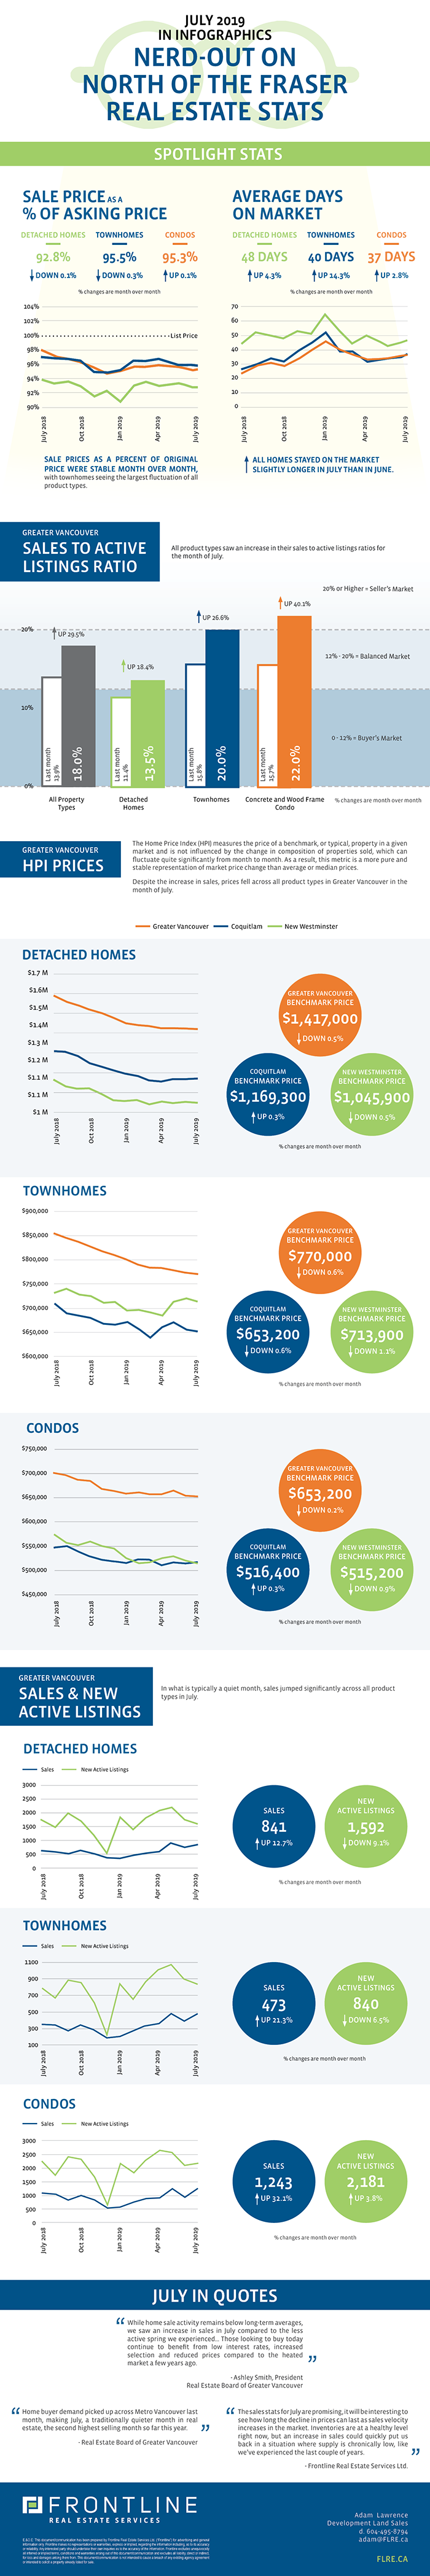
There were 2557 homes sold on the MLS in July, which was a 23.5% increase over the same month last year and was a 23.1% increase over last month’s total. While the uptick in activity is promising, the Board notes that total sales are still 7.8% below the 10 year average for the month. The detached home market, previously the most hamstrung product type, has made a bit of a resurgence in the last three months with a total of 2500 houses trading across Greater Vancouver during that time.
July’s strong sales resulted in a jump in the sales to active listings ratio for all home types. The overall ratio for all property types is now sitting at 18%, which is approaching what is generally thought of as a seller’s market. Should the observed increase in consumer demand and relatively low number of available listings both continue in the coming months, it will be interesting to see the impact on HPI Benchmark prices and whether the price declines observed over the last twelve months persist as we close out 2019.
What does this mean for development land north of the Fraser?
After a gloomy June, July’s stats are signalling that the Greater Vancouver market has hit its cyclical bottom and may be ready to start moving again – albeit at prices that are lower than those observed at the peak of the market. Developers have taken notice and are acting on well located, well priced opportunities with favourable terms.
While there are still good development opportunities available in our core markets north of the Fraser, the selection is not the same as it has been for most of 2019. Selection is dwindling with the current favourable market conditions.
Check out our curated summary of the Real Estate Board of Greater Vancouver’s June stats in infographics below.
Please note: areas covered by the Real Estate Board of Greater Vancouver include: Whistler, Sunshine Coast, Squamish, West Vancouver, North Vancouver, Vancouver, Burnaby, New Westminster, Richmond, Port Moody, Port Coquitlam, Coquitlam, Pitt Meadows, Maple Ridge, and South Delta.
View the Real Estate Board of Greater Vancouver’s entire stats package for July 2019 here.
This representation is based in whole or in part on data generated by the Real Estate Board of Greater Vancouver which assumes no responsibility for its accuracy.
