North of the Fraser Residential Real Estate: October 2018 Infographic
The October sales statistics from the Real Estate Board of Greater Vancouver indicate a more active market than has been observed in the past several months, but it is still quiet relative to historical sales volumes.
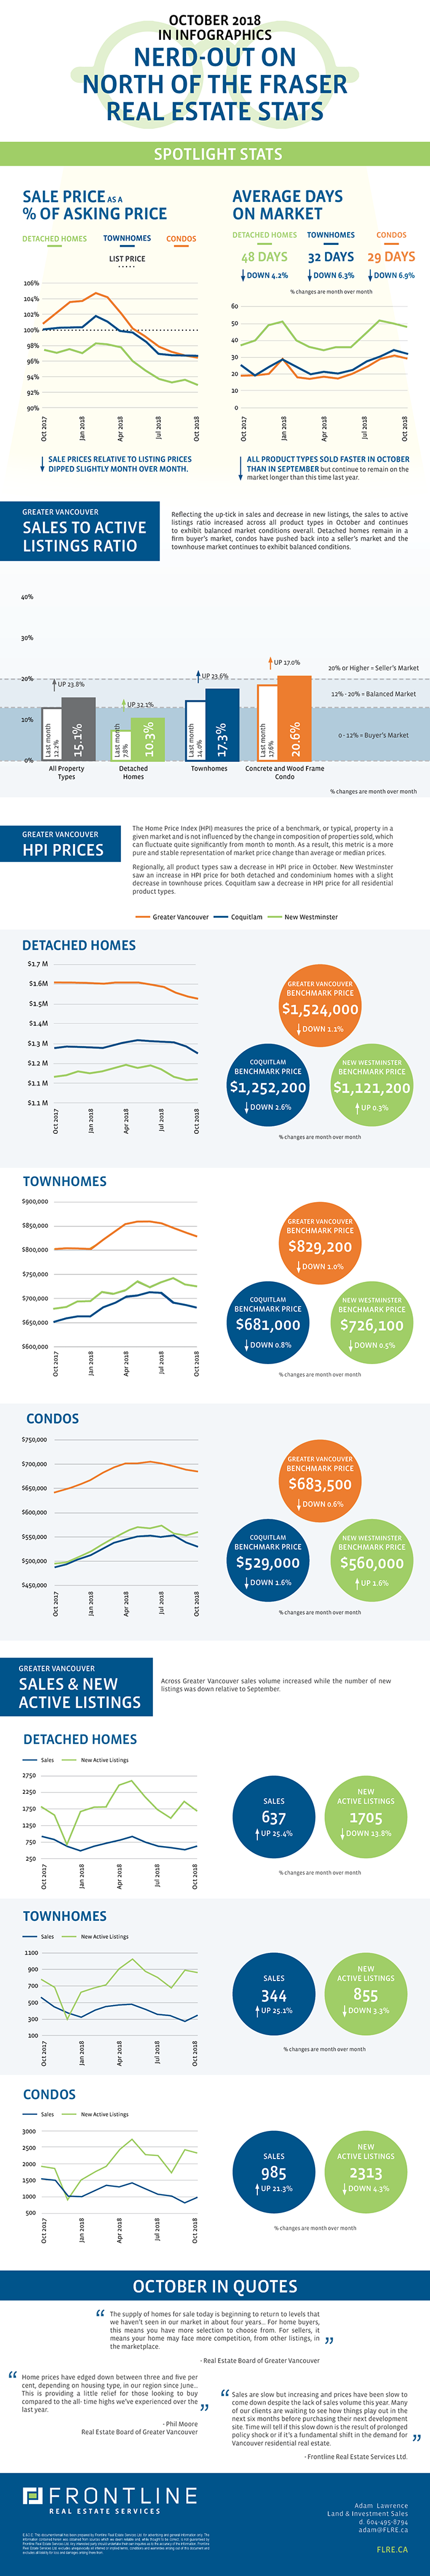
Residential home sales totalled 1,966 in October which was an increase of 23.3% from September’s performance, but it is still 26.8% below the 10 year October sales average and 34.9% below October 2017 sales volume.
The supply of homes for sale is starting to approach historical norms and is providing more choices for buyers. Across Greater Vancouver, there were 4,873 homes newly listed for sale in October which brings the total month end MLS inventory to 12,984. This represents a 42.1% increase compared to the 9,137 homes that were listed for sale in October 2017 and a marginal (0.8%) decrease from the 13,084 homes that were available on the MLS last month. The uptick in sales for the month facilitated an increase in the sales to active listings ratio across all product types, which is now 15.1%, consistent with what analysts consider a balanced market.
Benchmark prices continued to decrease marginally in October, but they are still higher than they were this time last year. The composite benchmark price for all home types across Greater Vancouver has come down 3.3% in the last three months, with detached homes seeing the largest drop of 3.9%.
What does this mean for development land in Greater Vancouver? Sales of new end product remain slow and revenues have come down slightly, however the increase in sales activity in October is promising for a market that has been facing a number of headwinds. The increase in activity in the single-family market is especially positive news as demand for this segment has been hit the hardest by government legislation and the reduced consumer purchasing power due to the mortgage qualification “stress test” implemented earlier this year.
With the Bank of Canada targeting multiple interest rate increases in the next several months, it will be interesting to see how the Vancouver market will respond and whether price gains realized in the last twelve months will hold. A massive correction seems unlikely at this point, but all signs indicate a continued flattening of revenues across all product types.
The slowdown in price appreciation has led to an increase in available development sites as many owners look to sell their property/properties near what they generally consider to be the peak. This has resulted in buyers having a wider variety of sites to choose from compared to this time last year and thus a decrease in urgency. As such, vendors of development land can expect to see continued interest in their property from developers, but with longer due diligence and closing periods and at lower price points than could have been expected 12 to 18 months ago.
Please note: areas covered by the Real Estate Board of Greater Vancouver include: Whistler, Sunshine Coast, Squamish, West Vancouver, North Vancouver, Vancouver, Burnaby, New Westminster, Richmond, Port Moody, Port Coquitlam, Coquitlam, Pitt Meadows, Maple Ridge, and South Delta.
View the Real Estate Board of Greater Vancouver’s entire stats package for October 2018 here.
This representation is based in whole or in part on data generated by the Real Estate Board of Greater Vancouver which assume no responsibility for its accuracy.
