Fraser Valley Residential Real Estate: January 2019 Infographic
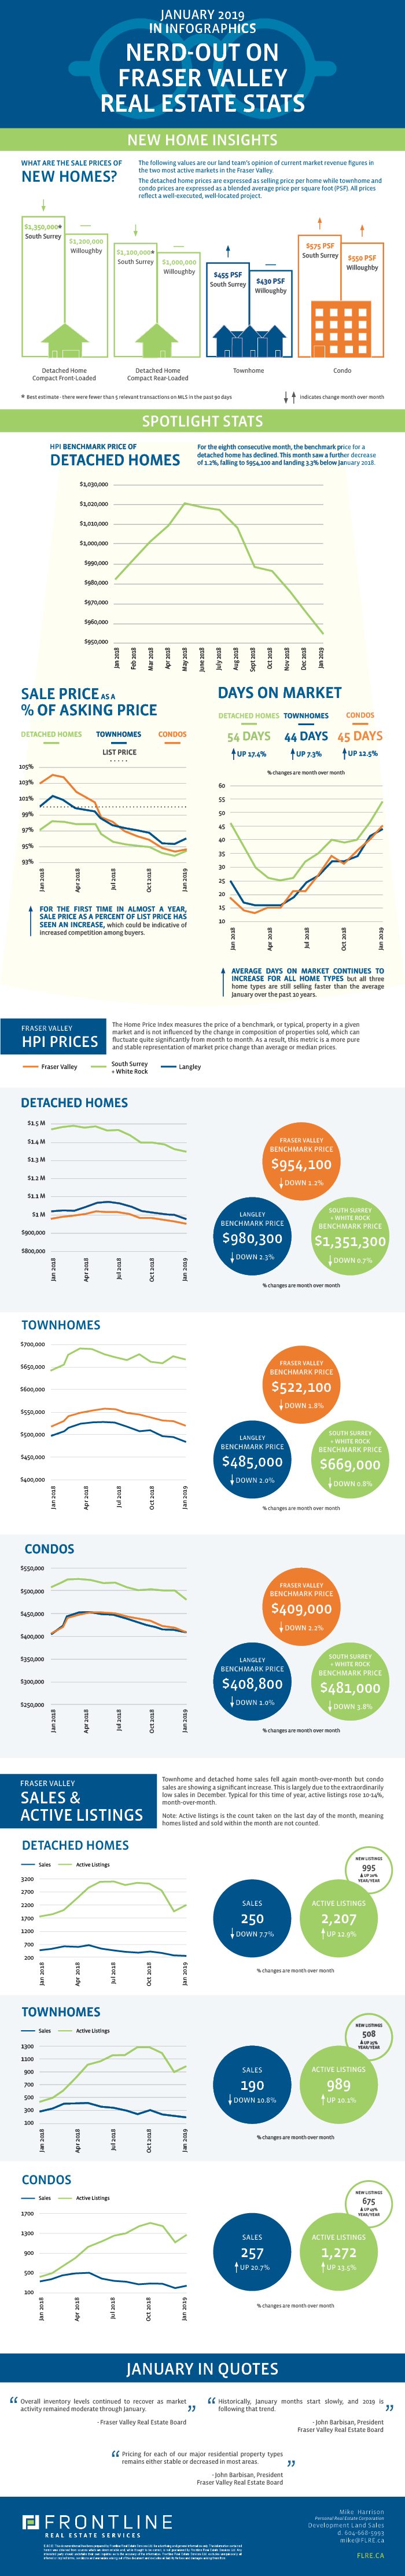
The Fraser Valley Real Estate Board’s stats are out for January and it’s largely a familiar story of market deceleration and winter lull; however, we may be seeing the first sign of increased competition among buyers since the market begun to decelerate late last year.
Overall, benchmark prices decreased slightly, month-over-month, across all product types with detached homes decreasing by 1.2%, townhomes by 2.0% and condos by 2.2%. Conversely, recent MLS sales of new attached homes are hinting at a slightly different story for some sub-markets. You’ll notice in the infographic below that our opinion of selling price per square foot of new condos in Willoughby as well as for new condos and townhomes in South Surrey is up from last month. Part of our analysis for these figures includes surveying average selling prices per square foot of new home sales on MLS, which sold over the past 90 days. Surprisingly, these figures increased for the 90 day period ending January 31st.
Characteristic of a winter lull, average days on market is up again over the previous month but all home types are still selling faster than the 10 year averages for the month of January. For example, the average days on market for townhomes in the valley jumped from 41 to 44 days but the 10 year average for January is 61 days.
Detached home and townhouse sales are down from last month by 8% and 11% respectively but condo sales were up almost 21% following an extraordinarily low December. Year-over-year, sales are down 24% to 44% depending on home type. Attached homes remain above 10 year averages for January but detached homes are a different story at only 64% of the 10 year average.
Unexpectedly, sale price as a percent of list price rose this month. This could either be our first sign of life for a spring market or that seller price expectations, and thus listing prices, are beginning to match market value. Regardless, this stat is going in a positive direction again and is consistent with a regular flow of anecdotal reports from builders that sales are picking up again at sales centres.
What does this mean for development land in the Fraser Valley? Development land buyers maintain a cautious attitude and underwriting remains conservative but the longer we go without the bottom falling out of the market, the more confidence seems to build among investors and developers. This confidence, however slight it may be, has some developers off the sidelines and sentiment shifting in a positive direction. In many cases there is still a gap between land owner price expectations and what buyers can justify paying, as land owners remain focused on historical sale prices from a time before end product prices dropped.
Check out our curated summary of the Fraser Valley Real Estate Board’s January stats in infographics below.
View the Fraser Valley Real Estate Board’s entire stats package for January 2019 here.
This representation is based in whole or in part on data generated by the Fraser Valley Real Estate Board which assumes no responsibility for its accuracy.
