North of the Fraser Residential Real Estate: January 2019 Infographic
The new year brought a surge of new listings to the Greater Vancouver housing market while prospective buyers continued their wait and see approach.
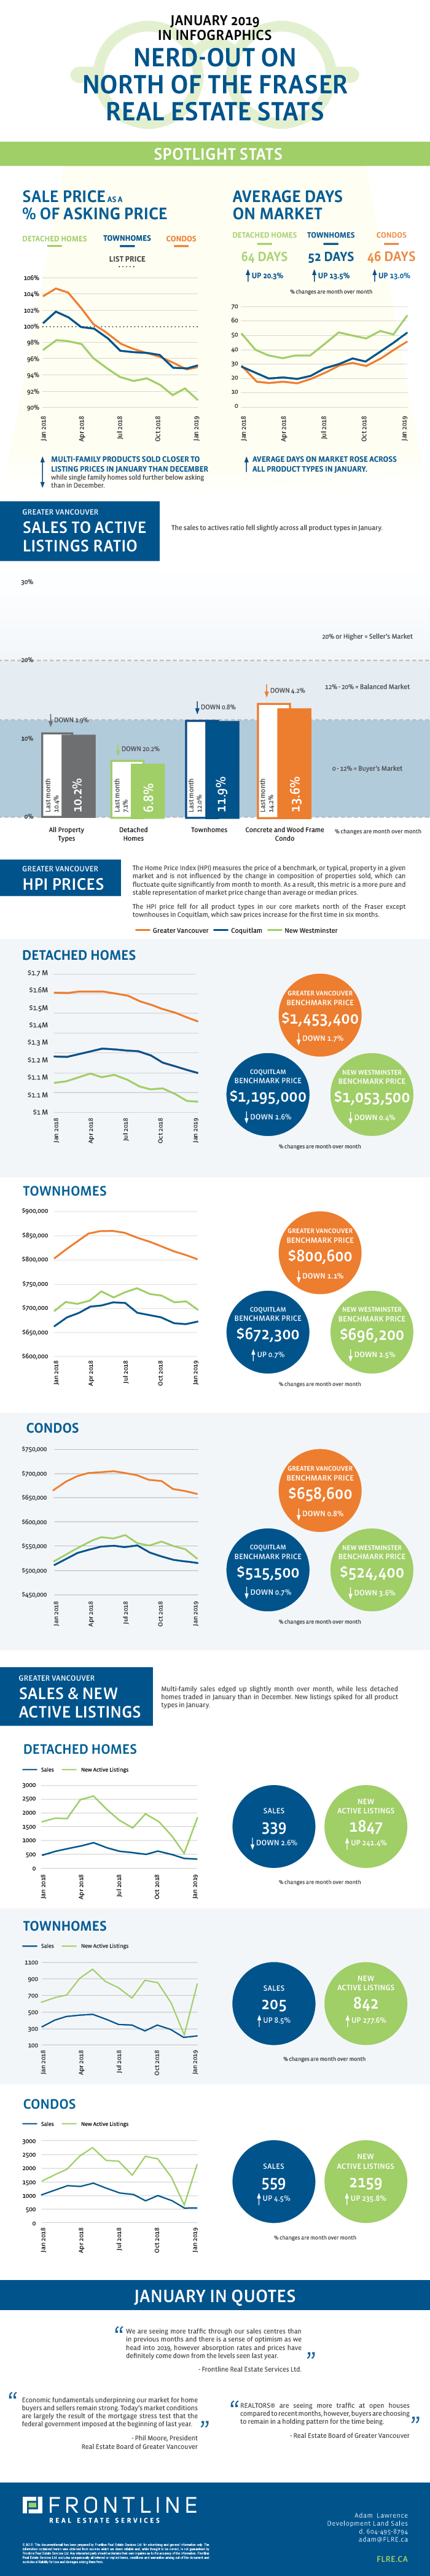
There were a total of 1,103 transactions in January, which was a 2.9% increase month over month. However, it was a 39.3% decrease from the same month last year and 36.3% below the 10 year sales average for the month of January, making it the slowest January in a decade.
Across Greater Vancouver, there were 4,848 new MLS listings in January which is about 27.7% higher than the same month last year and an incredible 244.6% increase over December. Clearly, a number of vendors that were on the fence over the last year and half have decided that the time to sell is now to avoid the risk of having to take a further price reduction.
The spike in new listings, coupled with the continued lull in sales, has now pushed the sales to active listings ratio further into a buyer’s market. The ratio for all product types is now 10.2% with single family at 6.8%, townhouse at 11.9% and condos maintaining what is considered a balanced market ratio of 13.6%.
What does this mean for development land in Greater Vancouver? While prices have come down across the region over the last 6 months, some suburban markets are seeing less dramatic declines than areas closer to the core. While Vancouver West and West Vancouver have seen the largest year over year benchmark pricing decreases at 14.1% and 15.4% respectively, Coquitlam and New Westminster have been resilient by comparison, particularly for multi-family product.
Our developer and builder clients are still reviewing well priced opportunities, however development sites are not as scarce as they were last year and, as such, urgency has diminished. There is still some pessimism in the market, despite reports of an uptick in activity at sales centres and open houses. Many buyers are waiting to see what level of activity the Spring market brings before exploring future acquisitions. One thing is for certain, buyers are going to have more choice and flexibility this year than in the recent past.
Check out our curated summary of the Real Estate Board of Greater Vancouver’s January stats in infographics below.
Please note: areas covered by the Real Estate Board of Greater Vancouver include: Whistler, Sunshine Coast, Squamish, West Vancouver, North Vancouver, Vancouver, Burnaby, New Westminster, Richmond, Port Moody, Port Coquitlam, Coquitlam, Pitt Meadows, Maple Ridge, and South Delta.
View the Real Estate Board of Greater Vancouver’s entire stats package for January 2019 here.
This representation is based in whole or in part on data generated by the Real Estate Board of Greater Vancouver which assume no responsibility for its accuracy.
