Fraser Valley Residential Real Estate: June 2019 Infographic
The June statistics are out from the Fraser Valley Real Estate Board and they are unexcitingly consistent with stats of historical June months. As May typically marks the peak of the residential market each year, June usually delivers a mild decrease in benchmark prices, a decline in sales, an increase in active listings and a higher average days on market. June 2019 maintained that trend and ended in what would be considered balanced market territory.
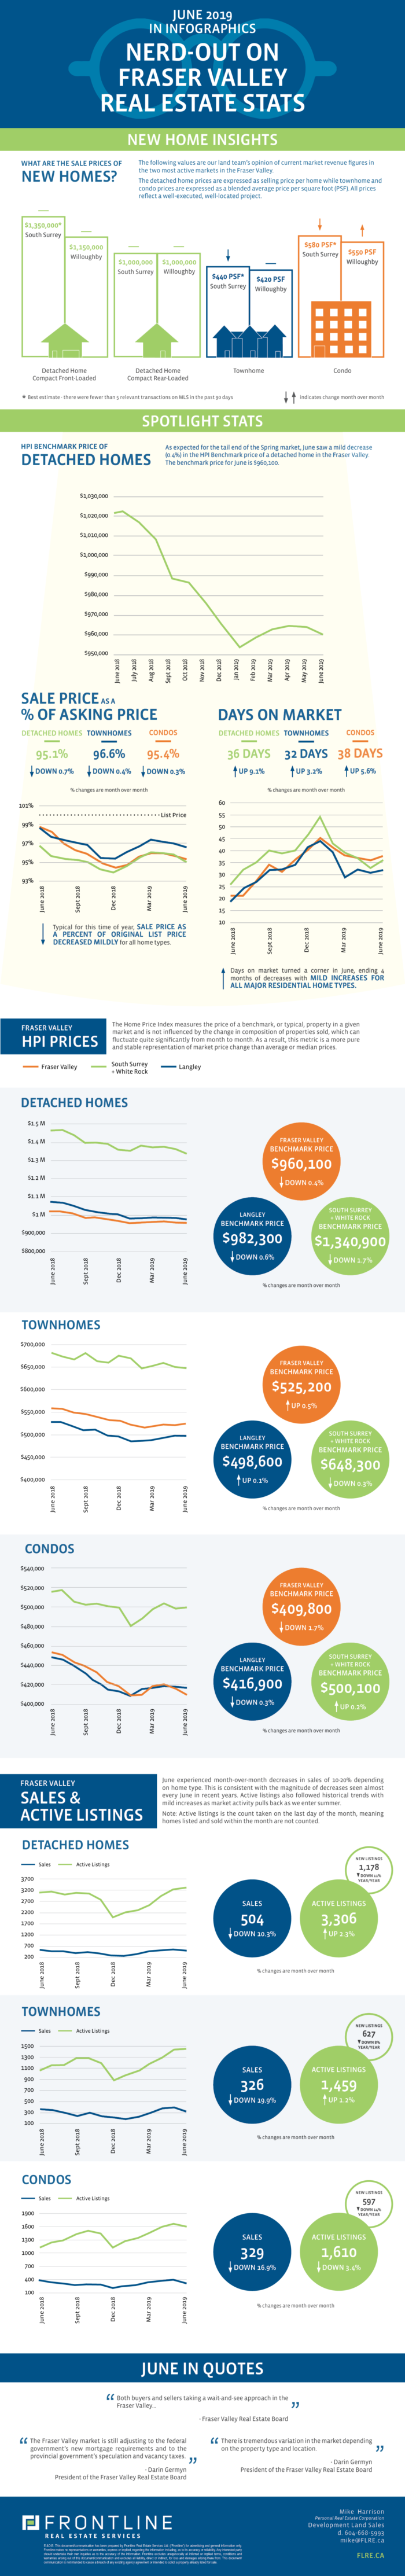
The HPI Benchmark price of detached homes decreased by 0.4% and condos decreased by 1.7%. Conversely, townhomes continue to outperform other home types, with a 0.5% increase in benchmark price over last month. Cloverdale and North Surrey pulled the Fraser Valley’s townhome HPI Benchmark price up, with month-over-month increases of 3.1% and 1.5% respectively.
Typical for June, sales decreased across all major residential home types. Month-over-month detached home sales dropped 10%, townhome sales dropped almost 20% and condo sales dropped 17%, resulting in total sales landing at 1,159, 74% of the 10 year average for June.
Active listings of detached homes rose by 2.3% and 1.2% for townhomes but declined 3.4% for condos, resulting in total active listings being flat compared to May. Active listings for June returned to levels seen between 2011 and 2015 but due to extraordinarily low listing levels the past few years, June listings are showing as 110% of the 10 year average.
As June closes out the end of the Spring market, it’s not surprising to see average days on market rise to 32-38 days, depending on home type. In context, the 10 year average for the month of June is 46 days for all home types.
What does this mean for development land in the Fraser Valley?
Sentiment among development land purchasers in the Fraser Valley remains largely positive although caution is being exercised as the slow-down in new residential project launches is making it difficult to identify true revenue figures for underwriting. Frankly, this severe lack of data made it difficult to establish our opinion of selling prices per square foot in this month’s our infographic.
Deal terms (due diligence and completion times) continue to relax, enticing many buyers to pursue their next purchase. There appears to be enough confidence among land buyers that most groups would consider making a purchase, especially for a well-located, readily developable townhome site.
Check out our curated summary of the Fraser Valley Real Estate Board’s June stats in infographics below.
View the Fraser Valley Real Estate Board’s entire stats package for June 2019 here.
This representation is based in whole or in part on data generated by the Fraser Valley Real Estate Board which assumes no responsibility for its accuracy.
