North of the Fraser Residential Real Estate: May 2019 Infographic
The May stats show a modest increase in home sales across the Greater Vancouver market, however, activity is still suppressed compared to historical norms. Notably, there were 2,638 residential transactions recorded on the MLS in May, which was the first time this year that more than 2,000 sales were reported. This figure represents a 44.2% increase over April’s sales, yet was still 6.9% below the number of transactions recorded in May 2018 and 22.9% below the 10 year average for the month, making it the slowest May on record since 2000.
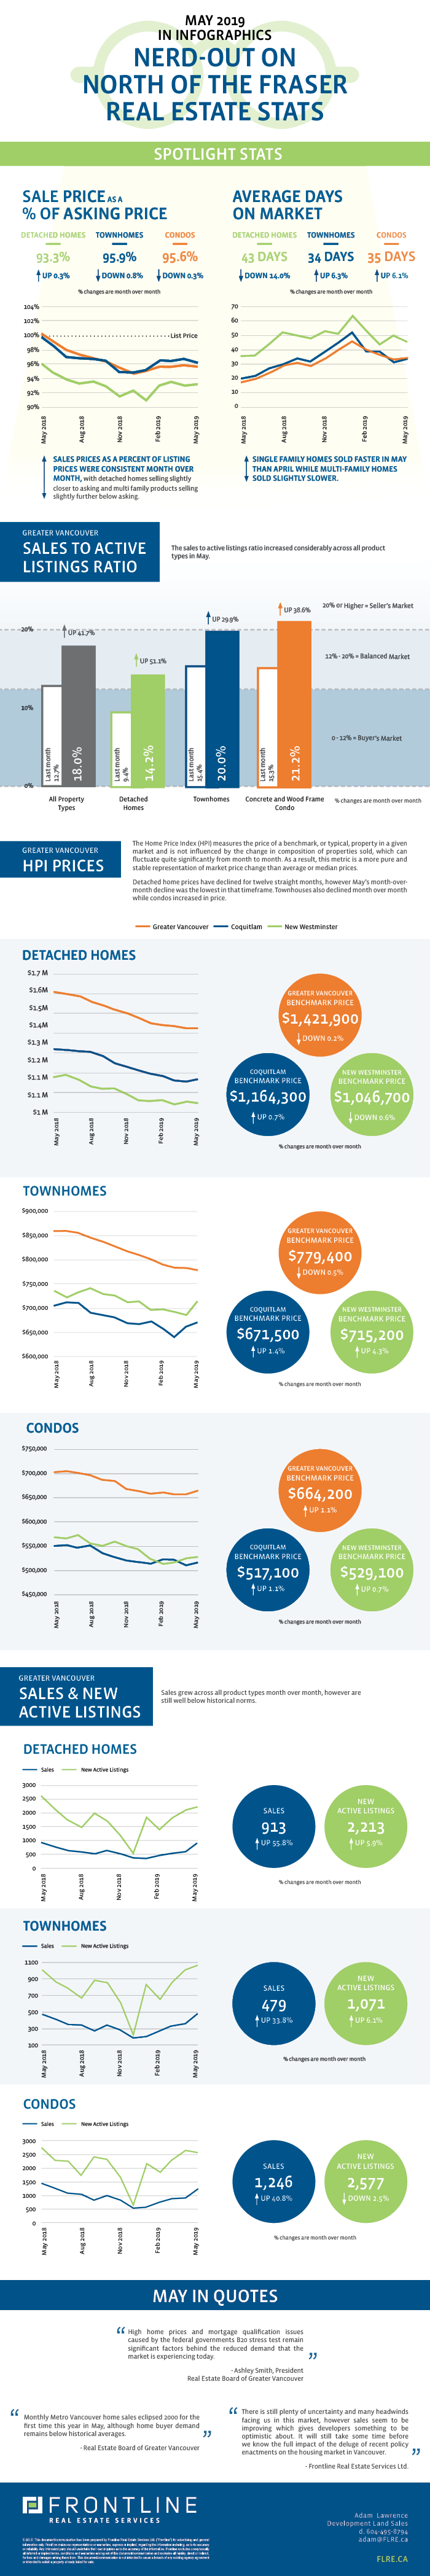
The inventory of available homes across the market continues to grow with 14,357 homes now listed on the MLS. The Board reports that this is the highest number of homes listed for sale in Greater Vancouver since September 2014, when 14,832 homes were available. It’s worth noting that while the inventory of listed homes continues to grow, the rate at which new homes are coming to market is actually slower than it was this time last year, confirming that the increase in inventory is more of a product of slow sales as opposed to a rush of new listings.
The sales to active listings ratio now sits at 18% for all product types. The detached home market is now considered a balanced market at 14.2% and townhouses and condos are heading back towards sellers’ markets at 20% and 21.2% respectively.
The MLS Benchmark Home Price Index (HPI) reflected declining prices across all product types and has now slid 8.9% since May of last year. Detached home prices have declined for twelve straight months; however, May’s month-over-month decline of 0.2% was the lowest in that timeframe. Townhouse prices also declined by 0.5% month-over-month while condos increased by 1.1%.
What does this mean for development land north of the Fraser?
While the increase in sales was a much welcomed bit of good news, homebuyer activity remains low relative to historic norms. Considering strong employment figures, near record low interest rates and a considerable drop in prices across the board, it’s surprising to see sales activity remain this low for this long. The mortgage stress test is undoubtedly hampering consumer’s abilities to capitalize on these favourable market conditions, but it’s also likely that many purchasers are waiting on the sidelines to see where the bottom is before making a commitment on a property.
The decrease in home buyer activity has resulted in a slower residential development land market than has been experienced over the last few years and this has resulted in a lot of available opportunities for developers, builders and investors to choose from right now. Despite the abundance of opportunities, the standoff between purchasers and vendors of development land continues, with bid prices still well below asking prices in many cases. While some vendors have capitulated on pricing, out of a need to sell, many others are happy to hold onto their properties and wait for more favourable market conditions to return. While May’s stats are promising, it’s likely that Summer 2019 will be quiet on the development land front in our core markets North of the Fraser.
Check out our curated summary of the Real Estate Board of Greater Vancouver’s May stats in infographics below.
Please note: areas covered by the Real Estate Board of Greater Vancouver include: Whistler, Sunshine Coast, Squamish, West Vancouver, North Vancouver, Vancouver, Burnaby, New Westminster, Richmond, Port Moody, Port Coquitlam, Coquitlam, Pitt Meadows, Maple Ridge, and South Delta.
View the Real Estate Board of Greater Vancouver’s entire stats package for May 2019 here.
This representation is based in whole or in part on data generated by the Real Estate Board of Greater Vancouver which assumes no responsibility for its accuracy.
